Crossroads: The Psychology of Immigration in the New Century
Crossroads: The Psychology of Immigration in the New Century
Crossroads: The Psychology of Immigration in the New Century
You also want an ePaper? Increase the reach of your titles
YUMPU automatically turns print PDFs into web optimized ePapers that Google loves.
Life span Considerations<br />
Look<strong>in</strong>g at foreign-born versus U.S.-born populations<br />
across <strong>the</strong> life span reveals some <strong>in</strong>terest<strong>in</strong>g<br />
comparisons. Accord<strong>in</strong>g to <strong>the</strong> U.S. Census Bureau<br />
(2009a, 2009b, 2011c), most <strong>of</strong> <strong>the</strong> foreign-born<br />
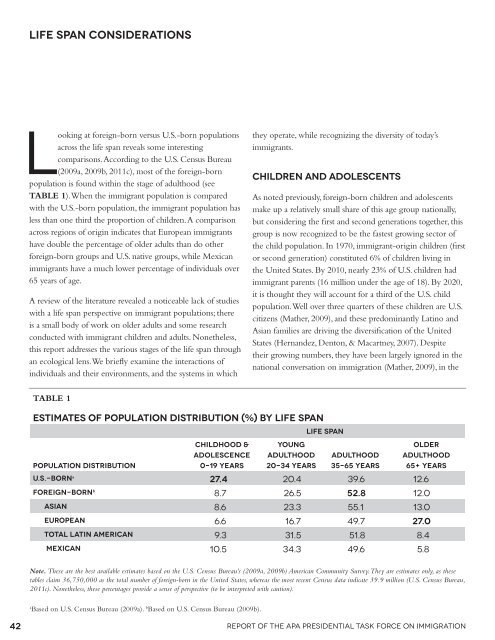
population is found with<strong>in</strong> <strong>the</strong> stage <strong>of</strong> adulthood (see<br />
TAbLE 1). When <strong>the</strong> immigrant population is compared<br />
with <strong>the</strong> U.S.-born population, <strong>the</strong> immigrant population has<br />
less than one third <strong>the</strong> proportion <strong>of</strong> children. A comparison<br />
across regions <strong>of</strong> orig<strong>in</strong> <strong>in</strong>dicates that European immigrants<br />
have double <strong>the</strong> percentage <strong>of</strong> older adults than do o<strong>the</strong>r<br />
foreign-born groups and U.S. native groups, while Mexican<br />
immigrants have a much lower percentage <strong>of</strong> <strong>in</strong>dividuals over<br />
65 years <strong>of</strong> age.<br />
A review <strong>of</strong> <strong>the</strong> literature revealed a noticeable lack <strong>of</strong> studies<br />
with a life span perspective on immigrant populations; <strong>the</strong>re<br />
is a small body <strong>of</strong> work on older adults and some research<br />
conducted with immigrant children and adults. None<strong>the</strong>less,<br />
this report addresses <strong>the</strong> various stages <strong>of</strong> <strong>the</strong> life span through<br />
an ecological lens. We briefly exam<strong>in</strong>e <strong>the</strong> <strong>in</strong>teractions <strong>of</strong><br />
<strong>in</strong>dividuals and <strong>the</strong>ir environments, and <strong>the</strong> systems <strong>in</strong> which<br />
TAbLE 1<br />
Estimates <strong>of</strong> Population distribution (%) by Life span<br />
Childhood &<br />
adolescence<br />
0–19 years<br />
<strong>the</strong>y operate, while recogniz<strong>in</strong>g <strong>the</strong> diversity <strong>of</strong> today’s<br />
immigrants.<br />
Children and adolescents<br />
As noted previously, foreign-born children and adolescents<br />
make up a relatively small share <strong>of</strong> this age group nationally,<br />
but consider<strong>in</strong>g <strong>the</strong> first and second generations toge<strong>the</strong>r, this<br />
group is now recognized to be <strong>the</strong> fastest grow<strong>in</strong>g sector <strong>of</strong><br />
<strong>the</strong> child population. In 1970, immigrant-orig<strong>in</strong> children (first<br />
or second generation) constituted 6% <strong>of</strong> children liv<strong>in</strong>g <strong>in</strong><br />
<strong>the</strong> United States. By 2010, nearly 23% <strong>of</strong> U.S. children had<br />
immigrant parents (16 million under <strong>the</strong> age <strong>of</strong> 18). By 2020,<br />
it is thought <strong>the</strong>y will account for a third <strong>of</strong> <strong>the</strong> U.S. child<br />
population. Well over three quarters <strong>of</strong> <strong>the</strong>se children are U.S.<br />
citizens (Ma<strong>the</strong>r, 2009), and <strong>the</strong>se predom<strong>in</strong>antly Lat<strong>in</strong>o and<br />
Asian families are driv<strong>in</strong>g <strong>the</strong> diversification <strong>of</strong> <strong>the</strong> United<br />
States (Hernandez, Denton, & Macartney, 2007). Despite<br />
<strong>the</strong>ir grow<strong>in</strong>g numbers, <strong>the</strong>y have been largely ignored <strong>in</strong> <strong>the</strong><br />
national conversation on immigration (Ma<strong>the</strong>r, 2009), <strong>in</strong> <strong>the</strong><br />
Young<br />
adulthood<br />
20–34 years<br />
Life span<br />
adulthood<br />
35–65 years<br />
older<br />
adulthood<br />
65+ years<br />
Population distribution<br />
U.s.-borna 27.4 20.4 39.6 12.6<br />
Foreign-bornb 8.7 26.5 52.8 12.0<br />
asian 8.6 23.3 55.1 13.0<br />
European 6.6 16.7 49.7 27.0<br />
Total Lat<strong>in</strong> american 9.3 31.5 51.8 8.4<br />
Mexican 10.5 34.3 49.6 5.8<br />
Note. <strong>The</strong>se are <strong>the</strong> best available estimates based on <strong>the</strong> U.S. Census Bureau’s (2009a, 2009b) American Community Survey. <strong>The</strong>y are estimates only, as <strong>the</strong>se<br />
tables claim 36,750,000 as <strong>the</strong> total number <strong>of</strong> foreign-born <strong>in</strong> <strong>the</strong> United States, whereas <strong>the</strong> most recent Census data <strong>in</strong>dicate 39.9 million (U.S. Census Bureau,<br />
2011c). None<strong>the</strong>less, <strong>the</strong>se percentages provide a sense <strong>of</strong> perspective (to be <strong>in</strong>terpreted with caution).<br />
a Based on U.S. Census Bureau (2009a). b Based on U.S. Census Bureau (2009b).<br />
42 Report <strong>of</strong> <strong>the</strong> APA Presidential Task Force on <strong>Immigration</strong>


