Development of Agribusiness Enterprises - Asian Productivity ...
Development of Agribusiness Enterprises - Asian Productivity ...
Development of Agribusiness Enterprises - Asian Productivity ...

Create successful ePaper yourself
Turn your PDF publications into a flip-book with our unique Google optimized e-Paper software.
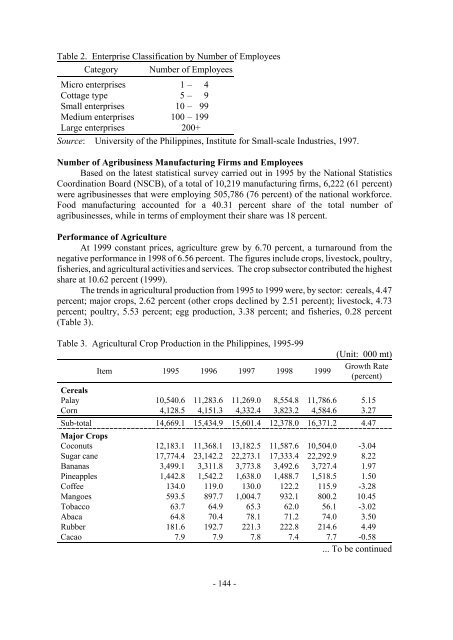
Table 2. Enterprise Classification by Number <strong>of</strong> Employees<br />
Category Number <strong>of</strong> Employees<br />
Micro enterprises 1 – 4<br />
Cottage type 5 – 9<br />
Small enterprises 10 – 99<br />
Medium enterprises 100 – 199<br />
Large enterprises 200+<br />
Source: University <strong>of</strong> the Philippines, Institute for Small-scale Industries, 1997.<br />
Number <strong>of</strong> <strong>Agribusiness</strong> Manufacturing Firms and Employees<br />
Based on the latest statistical survey carried out in 1995 by the National Statistics<br />
Coordination Board (NSCB), <strong>of</strong> a total <strong>of</strong> 10,219 manufacturing firms, 6,222 (61 percent)<br />
were agribusinesses that were employing 505,786 (76 percent) <strong>of</strong> the national workforce.<br />
Food manufacturing accounted for a 40.31 percent share <strong>of</strong> the total number <strong>of</strong><br />
agribusinesses, while in terms <strong>of</strong> employment their share was 18 percent.<br />
Performance <strong>of</strong> Agriculture<br />
At 1999 constant prices, agriculture grew by 6.70 percent, a turnaround from the<br />
negative performance in 1998 <strong>of</strong> 6.56 percent. The figures include crops, livestock, poultry,<br />
fisheries, and agricultural activities and services. The crop subsector contributed the highest<br />
share at 10.62 percent (1999).<br />
The trends in agricultural production from 1995 to 1999 were, by sector: cereals, 4.47<br />
percent; major crops, 2.62 percent (other crops declined by 2.51 percent); livestock, 4.73<br />
percent; poultry, 5.53 percent; egg production, 3.38 percent; and fisheries, 0.28 percent<br />
(Table 3).<br />
Table 3. Agricultural Crop Production in the Philippines, 1995-99<br />
Item 1995 1996 1997 1998 1999<br />
(Unit: 000 mt)<br />
Growth Rate<br />
(percent)<br />
Cereals<br />
Palay 10,540.6 11,283.6 11,269.0 8,554.8 11,786.6 5.15<br />
Corn 4,128.5 4,151.3 4,332.4 3,823.2 4,584.6 3.27<br />
Sub-total<br />
Major Crops<br />
14,669.1 15,434.9 15,601.4 12,378.0 16,371.2 4.47<br />
Coconuts 12,183.1 11,368.1 13,182.5 11,587.6 10,504.0 -3.04<br />
Sugar cane 17,774.4 23,142.2 22,273.1 17,333.4 22,292.9 8.22<br />
Bananas 3,499.1 3,311.8 3,773.8 3,492.6 3,727.4 1.97<br />
Pineapples 1,442.8 1,542.2 1,638.0 1,488.7 1,518.5 1.50<br />
C<strong>of</strong>fee 134.0 119.0 130.0 122.2 115.9 -3.28<br />
Mangoes 593.5 897.7 1,004.7 932.1 800.2 10.45<br />
Tobacco 63.7 64.9 65.3 62.0 56.1 -3.02<br />
Abaca 64.8 70.4 78.1 71.2 74.0 3.50<br />
Rubber 181.6 192.7 221.3 222.8 214.6 4.49<br />
Cacao 7.9 7.9 7.8 7.4 7.7 -0.58<br />
... To be continued<br />
- 144 -