Development of Agribusiness Enterprises - Asian Productivity ...
Development of Agribusiness Enterprises - Asian Productivity ...
Development of Agribusiness Enterprises - Asian Productivity ...

You also want an ePaper? Increase the reach of your titles
YUMPU automatically turns print PDFs into web optimized ePapers that Google loves.
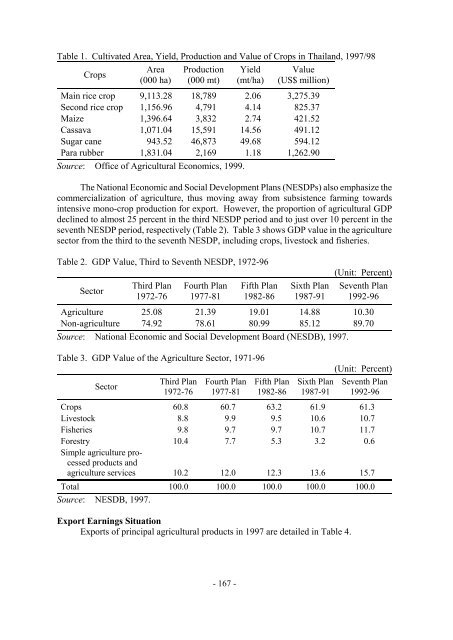
Table 1. Cultivated Area, Yield, Production and Value <strong>of</strong> Crops in Thailand, 1997/98<br />
Crops<br />
Area<br />
(000 ha)<br />
Production<br />
(000 mt)<br />
- 167 -<br />
Yield<br />
(mt/ha)<br />
Value<br />
(US$ million)<br />
Main rice crop 9,113.28 18,789 2.06 3,275.39<br />
Second rice crop 1,156.96 4,791 4.14 825.37<br />
Maize 1,396.64 3,832 2.74 421.52<br />
Cassava 1,071.04 15,591 14.56 491.12<br />
Sugar cane 943.52 46,873 49.68 594.12<br />
Para rubber 1,831.04 2,169 1.18 1,262.90<br />
Source: Office <strong>of</strong> Agricultural Economics, 1999.<br />
The National Economic and Social <strong>Development</strong> Plans (NESDPs) also emphasize the<br />
commercialization <strong>of</strong> agriculture, thus moving away from subsistence farming towards<br />
intensive mono-crop production for export. However, the proportion <strong>of</strong> agricultural GDP<br />
declined to almost 25 percent in the third NESDP period and to just over 10 percent in the<br />
seventh NESDP period, respectively (Table 2). Table 3 shows GDP value in the agriculture<br />
sector from the third to the seventh NESDP, including crops, livestock and fisheries.<br />
Table 2. GDP Value, Third to Seventh NESDP, 1972-96<br />
Sector<br />
Third Plan<br />
1972-76<br />
Fourth Plan<br />
1977-81<br />
Fifth Plan<br />
1982-86<br />
Sixth Plan<br />
1987-91<br />
(Unit: Percent)<br />
Seventh Plan<br />
1992-96<br />
Agriculture 25.08 21.39 19.01 14.88 10.30<br />
Non-agriculture 74.92 78.61 80.99 85.12 89.70<br />
Source: National Economic and Social <strong>Development</strong> Board (NESDB), 1997.<br />
Table 3. GDP Value <strong>of</strong> the Agriculture Sector, 1971-96<br />
Sector<br />
Third Plan<br />
1972-76<br />
Fourth Plan<br />
1977-81<br />
Fifth Plan<br />
1982-86<br />
Sixth Plan<br />
1987-91<br />
(Unit: Percent)<br />
Seventh Plan<br />
1992-96<br />
Crops 60.8 60.7 63.2 61.9 61.3<br />
Livestock 8.8 9.9 9.5 10.6 10.7<br />
Fisheries 9.8 9.7 9.7 10.7 11.7<br />
Forestry<br />
Simple agriculture processed<br />
products and<br />
10.4 7.7 5.3 3.2 0.6<br />
agriculture services 10.2 12.0 12.3 13.6 15.7<br />
Total 100.0 100.0 100.0 100.0 100.0<br />
Source: NESDB, 1997.<br />
Export Earnings Situation<br />
Exports <strong>of</strong> principal agricultural products in 1997 are detailed in Table 4.