Development of Agribusiness Enterprises - Asian Productivity ...
Development of Agribusiness Enterprises - Asian Productivity ...
Development of Agribusiness Enterprises - Asian Productivity ...

You also want an ePaper? Increase the reach of your titles
YUMPU automatically turns print PDFs into web optimized ePapers that Google loves.
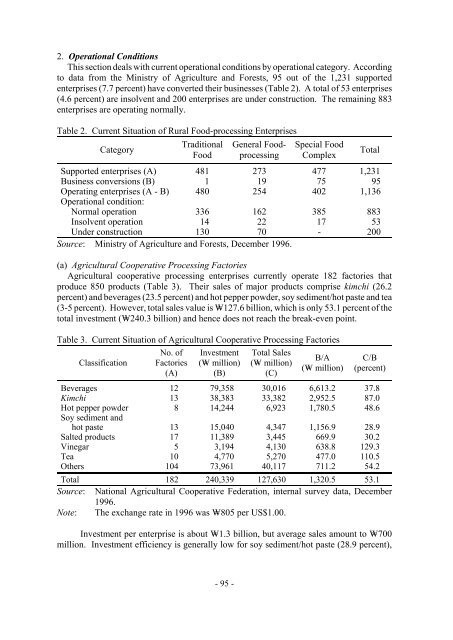
2. Operational Conditions<br />
This section deals with current operational conditions by operational category. According<br />
to data from the Ministry <strong>of</strong> Agriculture and Forests, 95 out <strong>of</strong> the 1,231 supported<br />
enterprises (7.7 percent) have converted their businesses (Table 2). A total <strong>of</strong> 53 enterprises<br />
(4.6 percent) are insolvent and 200 enterprises are under construction. The remaining 883<br />
enterprises are operating normally.<br />
Table 2. Current Situation <strong>of</strong> Rural Food-processing <strong>Enterprises</strong><br />
Category<br />
Traditional<br />
Food<br />
- 95 -<br />
General Foodprocessing<br />
Special Food<br />
Complex<br />
Total<br />
Supported enterprises (A) 481 273 477 1,231<br />
Business conversions (B) 1 19 75 95<br />
Operating enterprises (A - B) 480 254 402 1,136<br />
Operational condition:<br />
Normal operation 336 162 385 883<br />
Insolvent operation 14 22 17 53<br />
Under construction 130 70 - 200<br />
Source: Ministry <strong>of</strong> Agriculture and Forests, December 1996.<br />
(a) Agricultural Cooperative Processing Factories<br />
Agricultural cooperative processing enterprises currently operate 182 factories that<br />
produce 850 products (Table 3). Their sales <strong>of</strong> major products comprise kimchi (26.2<br />
percent) and beverages (23.5 percent) and hot pepper powder, soy sediment/hot paste and tea<br />
(3-5 percent). However, total sales value is W= 127.6 billion, which is only 53.1 percent <strong>of</strong> the<br />
total investment (W= 240.3 billion) and hence does not reach the break-even point.<br />
Table 3. Current Situation <strong>of</strong> Agricultural Cooperative Processing Factories<br />
Classification<br />
No. <strong>of</strong><br />
Factories<br />
(A)<br />
Investment<br />
(W= million)<br />
(B)<br />
Total Sales<br />
(W= million)<br />
(C)<br />
B/A<br />
(W= million)<br />
C/B<br />
(percent)<br />
Beverages 12 79,358 30,016 6,613.2 37.8<br />
Kimchi 13 38,383 33,382 2,952.5 87.0<br />
Hot pepper powder<br />
Soy sediment and<br />
8 14,244 6,923 1,780.5 48.6<br />
hot paste 13 15,040 4,347 1,156.9 28.9<br />
Salted products 17 11,389 3,445 669.9 30.2<br />
Vinegar 5 3,194 4,130 638.8 129.3<br />
Tea 10 4,770 5,270 477.0 110.5<br />
Others 104 73,961 40,117 711.2 54.2<br />
Total 182 240,339 127,630 1,320.5 53.1<br />
Source: National Agricultural Cooperative Federation, internal survey data, December<br />
1996.<br />
Note: The exchange rate in 1996 was W= 805 per US$1.00.<br />
Investment per enterprise is about W= 1.3 billion, but average sales amount to W= 700<br />
million. Investment efficiency is generally low for soy sediment/hot paste (28.9 percent),