Development of Agribusiness Enterprises - Asian Productivity ...
Development of Agribusiness Enterprises - Asian Productivity ...
Development of Agribusiness Enterprises - Asian Productivity ...

Create successful ePaper yourself
Turn your PDF publications into a flip-book with our unique Google optimized e-Paper software.
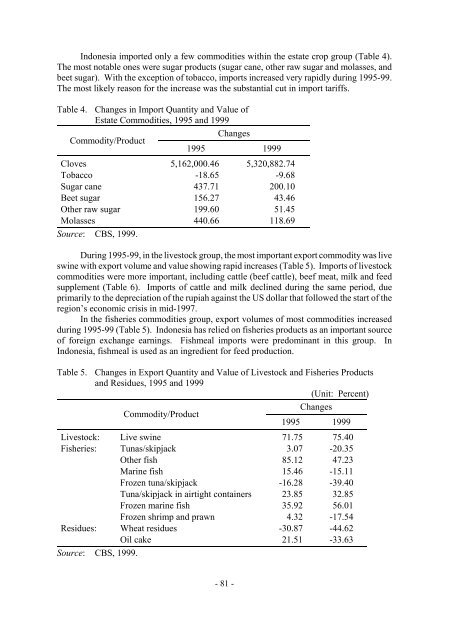
Indonesia imported only a few commodities within the estate crop group (Table 4).<br />
The most notable ones were sugar products (sugar cane, other raw sugar and molasses, and<br />
beet sugar). With the exception <strong>of</strong> tobacco, imports increased very rapidly during 1995-99.<br />
The most likely reason for the increase was the substantial cut in import tariffs.<br />
Table 4. Changes in Import Quantity and Value <strong>of</strong><br />
Estate Commodities, 1995 and 1999<br />
Commodity/Product<br />
1995<br />
Changes<br />
1999<br />
Cloves 5,162,000.46 5,320,882.74<br />
Tobacco -18.65 -9.68<br />
Sugar cane 437.71 200.10<br />
Beet sugar 156.27 43.46<br />
Other raw sugar 199.60 51.45<br />
Molasses 440.66 118.69<br />
Source: CBS, 1999.<br />
During 1995-99, in the livestock group, the most important export commodity was live<br />
swine with export volume and value showing rapid increases (Table 5). Imports <strong>of</strong> livestock<br />
commodities were more important, including cattle (beef cattle), beef meat, milk and feed<br />
supplement (Table 6). Imports <strong>of</strong> cattle and milk declined during the same period, due<br />
primarily to the depreciation <strong>of</strong> the rupiah against the US dollar that followed the start <strong>of</strong> the<br />
region’s economic crisis in mid-1997.<br />
In the fisheries commodities group, export volumes <strong>of</strong> most commodities increased<br />
during 1995-99 (Table 5). Indonesia has relied on fisheries products as an important source<br />
<strong>of</strong> foreign exchange earnings. Fishmeal imports were predominant in this group. In<br />
Indonesia, fishmeal is used as an ingredient for feed production.<br />
Table 5. Changes in Export Quantity and Value <strong>of</strong> Livestock and Fisheries Products<br />
and Residues, 1995 and 1999<br />
(Unit: Percent)<br />
Commodity/Product<br />
Changes<br />
1995 1999<br />
Livestock: Live swine 71.75 75.40<br />
Fisheries: Tunas/skipjack 3.07 -20.35<br />
Other fish 85.12 47.23<br />
Marine fish 15.46 -15.11<br />
Frozen tuna/skipjack -16.28 -39.40<br />
Tuna/skipjack in airtight containers 23.85 32.85<br />
Frozen marine fish 35.92 56.01<br />
Frozen shrimp and prawn 4.32 -17.54<br />
Residues: Wheat residues -30.87 -44.62<br />
Oil cake 21.51 -33.63<br />
Source: CBS, 1999.<br />
- 81 -