Development of Agribusiness Enterprises - Asian Productivity ...
Development of Agribusiness Enterprises - Asian Productivity ...
Development of Agribusiness Enterprises - Asian Productivity ...

You also want an ePaper? Increase the reach of your titles
YUMPU automatically turns print PDFs into web optimized ePapers that Google loves.
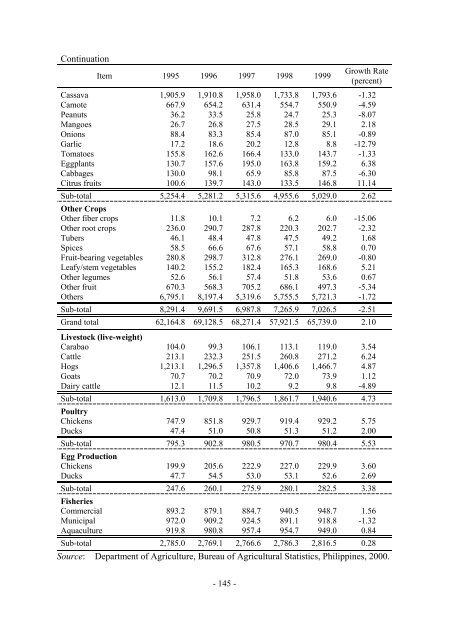
Continuation<br />
Item 1995 1996 1997 1998 1999<br />
Growth Rate<br />
(percent)<br />
Cassava 1,905.9 1,910.8 1,958.0 1,733.8 1,793.6 -1.32<br />
Camote 667.9 654.2 631.4 554.7 550.9 -4.59<br />
Peanuts 36.2 33.5 25.8 24.7 25.3 -8.07<br />
Mangoes 26.7 26.8 27.5 28.5 29.1 2.18<br />
Onions 88.4 83.3 85.4 87.0 85.1 -0.89<br />
Garlic 17.2 18.6 20.2 12.8 8.8 -12.79<br />
Tomatoes 155.8 162.6 166.4 133.0 143.7 -1.33<br />
Eggplants 130.7 157.6 195.0 163.8 159.2 6.38<br />
Cabbages 130.0 98.1 65.9 85.8 87.5 -6.30<br />
Citrus fruits 100.6 139.7 143.0 133.5 146.8 11.14<br />
Sub-total<br />
Other Crops<br />
5,254.4 5,281.2 5,315.6 4,955.6 5,029.0 2.62<br />
Other fiber crops 11.8 10.1 7.2 6.2 6.0 -15.06<br />
Other root crops 236.0 290.7 287.8 220.3 202.7 -2.32<br />
Tubers 46.1 48.4 47.8 47.5 49.2 1.68<br />
Spices 58.5 66.6 67.6 57.1 58.8 0.70<br />
Fruit-bearing vegetables 280.8 298.7 312.8 276.1 269.0 -0.80<br />
Leafy/stem vegetables 140.2 155.2 182.4 165.3 168.6 5.21<br />
Other legumes 52.6 56.1 57.4 51.8 53.6 0.67<br />
Other fruit 670.3 568.3 705.2 686.1 497.3 -5.34<br />
Others 6,795.1 8,197.4 5,319.6 5,755.5 5,721.3 -1.72<br />
Sub-total 8,291.4 9,691.5 6,987.8 7,265.9 7,026.5 -2.51<br />
Grand total<br />
Livestock (live-weight)<br />
62,164.8 69,128.5 68,271.4 57,921.5 65,739.0 2.10<br />
Carabao 104.0 99.3 106.1 113.1 119.0 3.54<br />
Cattle 213.1 232.3 251.5 260.8 271.2 6.24<br />
Hogs 1,213.1 1,296.5 1,357.8 1,406.6 1,466.7 4.87<br />
Goats 70.7 70.2 70.9 72.0 73.9 1.12<br />
Dairy cattle 12.1 11.5 10.2 9.2 9.8 -4.89<br />
Sub-total<br />
Poultry<br />
1,613.0 1,709.8 1,796.5 1,861.7 1,940.6 4.73<br />
Chickens 747.9 851.8 929.7 919.4 929.2 5.75<br />
Ducks 47.4 51.0 50.8 51.3 51.2 2.00<br />
Sub-total<br />
Egg Production<br />
795.3 902.8 980.5 970.7 980.4 5.53<br />
Chickens 199.9 205.6 222.9 227.0 229.9 3.60<br />
Ducks 47.7 54.5 53.0 53.1 52.6 2.69<br />
Sub-total<br />
Fisheries<br />
247.6 260.1 275.9 280.1 282.5 3.38<br />
Commercial 893.2 879.1 884.7 940.5 948.7 1.56<br />
Municipal 972.0 909.2 924.5 891.1 918.8 -1.32<br />
Aquaculture 919.8 980.8 957.4 954.7 949.0 0.84<br />
Sub-total 2,785.0 2,769.1 2,766.6 2,786.3 2,816.5 0.28<br />
Source: Department <strong>of</strong> Agriculture, Bureau <strong>of</strong> Agricultural Statistics, Philippines, 2000.<br />
- 145 -