TESTING INTERNATIONAL PRICE TRANSMISSION UNDER ...
TESTING INTERNATIONAL PRICE TRANSMISSION UNDER ...
TESTING INTERNATIONAL PRICE TRANSMISSION UNDER ...

You also want an ePaper? Increase the reach of your titles
YUMPU automatically turns print PDFs into web optimized ePapers that Google loves.
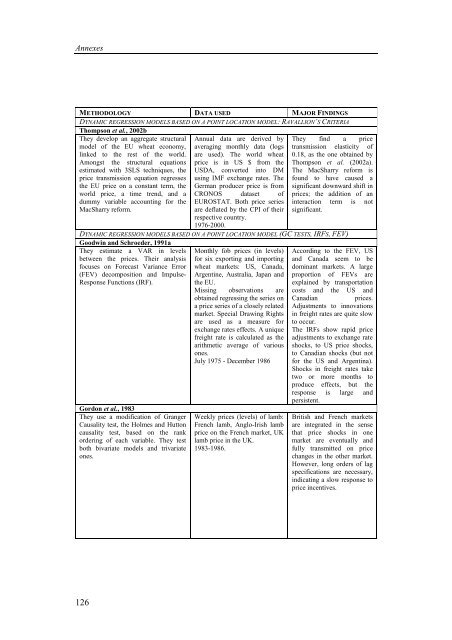
Annexes<br />
METHODOLOGY DATA USED MAJOR FINDINGS<br />
DYNAMIC REGRESSION MODELS BASED ON A POINT LOCATION MODEL: RAVALLION’S CRITERIA<br />
Thompson et al., 2002b<br />
They develop an aggregate structural<br />
model of the EU wheat economy,<br />
linked to the rest of the world.<br />
Amongst the structural equations<br />
estimated with 3SLS techniques, the<br />
price transmission equation regresses<br />
the EU price on a constant term, the<br />
world price, a time trend, and a<br />
dummy variable accounting for the<br />
MacSharry reform.<br />
126<br />
Annual data are derived by<br />
averaging monthly data (logs<br />
are used). The world wheat<br />
price is in US $ from the<br />
USDA, converted into DM<br />
using IMF exchange rates. The<br />
German producer price is from<br />
CRONOS dataset of<br />
EUROSTAT. Both price series<br />
are deflated by the CPI of their<br />
respective country.<br />
1976-2000.<br />
They find a price<br />
transmission elasticity of<br />
0.18, as the one obtained by<br />
Thompson et al. (2002a).<br />
The MacSharry reform is<br />
found to have caused a<br />
significant downward shift in<br />
prices; the addition of an<br />
interaction term is not<br />
significant.<br />
DYNAMIC REGRESSION MODELS BASED ON A POINT LOCATION MODEL (GC TESTS, IRFS, FEV)<br />
Goodwin and Schroeder, 1991a<br />
They estimate a VAR in levels<br />
between the prices. Their analysis<br />
focuses on Forecast Variance Error<br />
(FEV) decomposition and Impulse-<br />
Response Functions (IRF).<br />
Gordon et al., 1983<br />
They use a modification of Granger<br />
Causality test, the Holmes and Hutton<br />
causality test, based on the rank<br />
ordering of each variable. They test<br />
both bivariate models and trivariate<br />
ones.<br />
Monthly fob prices (in levels)<br />
for six exporting and importing<br />
wheat markets: US, Canada,<br />
Argentine, Australia, Japan and<br />
the EU.<br />
Missing observations are<br />
obtained regressing the series on<br />
a price series of a closely related<br />
market. Special Drawing Rights<br />
are used as a measure for<br />
exchange rates effects. A unique<br />
freight rate is calculated as the<br />
arithmetic average of various<br />
ones.<br />
July 1975 - December 1986<br />
Weekly prices (levels) of lamb:<br />
French lamb, Anglo-Irish lamb<br />
price on the French market, UK<br />
lamb price in the UK.<br />
1983-1986.<br />
According to the FEV, US<br />
and Canada seem to be<br />
dominant markets. A large<br />
proportion of FEVs are<br />
explained by transportation<br />
costs and the US and<br />
Canadian prices.<br />
Adjustments to innovations<br />
in freight rates are quite slow<br />
to occur.<br />
The IRFs show rapid price<br />
adjustments to exchange rate<br />
shocks, to US price shocks,<br />
to Canadian shocks (but not<br />
for the US and Argentina).<br />
Shocks in freight rates take<br />
two or more months to<br />
produce effects, but the<br />
response is large and<br />
persistent.<br />
British and French markets<br />
are integrated in the sense<br />
that price shocks in one<br />
market are eventually and<br />
fully transmitted on price<br />
changes in the other market.<br />
However, long orders of lag<br />
specifications are necessary,<br />
indicating a slow response to<br />
price incentives.