TESTING INTERNATIONAL PRICE TRANSMISSION UNDER ...
TESTING INTERNATIONAL PRICE TRANSMISSION UNDER ...
TESTING INTERNATIONAL PRICE TRANSMISSION UNDER ...

You also want an ePaper? Increase the reach of your titles
YUMPU automatically turns print PDFs into web optimized ePapers that Google loves.
Empirical Analysis: Cointegration Models Accounting for Policy Regime Changes<br />
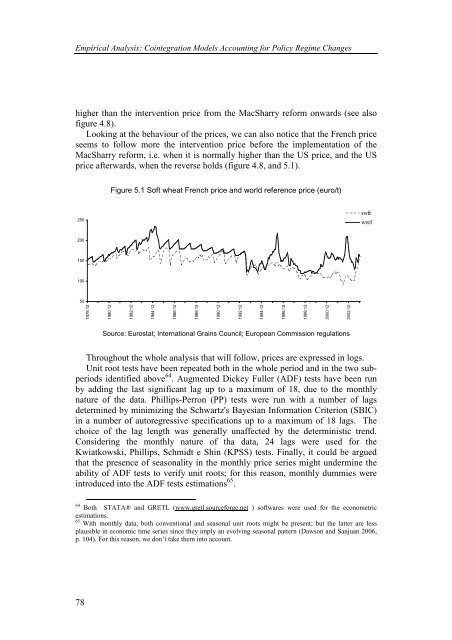
higher than the intervention price from the MacSharry reform onwards (see also<br />
figure 4.8).<br />
Looking at the behaviour of the prices, we can also notice that the French price<br />
seems to follow more the intervention price before the implementation of the<br />
MacSharry reform, i.e. when it is normally higher than the US price, and the US<br />
price afterwards, when the reverse holds (figure 4.8, and 5.1).<br />
250<br />
200<br />
150<br />
100<br />
50<br />
78<br />
1978:12<br />
1980:12<br />
Figure 5.1 Soft wheat French price and world reference price (euro/t)<br />
1982:12<br />
1984:12<br />
1986:12<br />
1988:12<br />
1990:12<br />
Source: Eurostat; International Grains Council; European Commission regulations<br />
Throughout the whole analysis that will follow, prices are expressed in logs.<br />
Unit root tests have been repeated both in the whole period and in the two subperiods<br />
identified above 64 . Augmented Dickey Fuller (ADF) tests have been run<br />
by adding the last significant lag up to a maximum of 18, due to the monthly<br />
nature of the data. Phillips-Perron (PP) tests were run with a number of lags<br />
determined by minimizing the Schwartz's Bayesian Information Criterion (SBIC)<br />
in a number of autoregressive specifications up to a maximum of 18 lags. The<br />
choice of the lag length was generally unaffected by the deterministic trend.<br />
Considering the monthly nature of tha data, 24 lags were used for the<br />
Kwiatkowski, Phillips, Schmidt e Shin (KPSS) tests. Finally, it could be argued<br />
that the presence of seasonality in the monthly price series might undermine the<br />
ability of ADF tests to verify unit roots; for this reason, monthly dummies were<br />
introduced into the ADF tests estimations 65 .<br />
64<br />
Both STATA® and GRETL (www.gretl.sourceforge.net ) softwares were used for the econometric<br />
estimations.<br />
65<br />
With monthly data, both conventional and seasonal unit roots might be present; but the latter are less<br />
plausible in economic time series since they imply an evolving seasonal pattern (Dawson and Sanjuan 2006,<br />
p. 104). For this reason, we don’t take them into account.<br />
1992:12<br />
1994:12<br />
1996:12<br />
1998:12<br />
2000:12<br />
2002:12<br />
swfr<br />
wref