TESTING INTERNATIONAL PRICE TRANSMISSION UNDER ...
TESTING INTERNATIONAL PRICE TRANSMISSION UNDER ...
TESTING INTERNATIONAL PRICE TRANSMISSION UNDER ...

Create successful ePaper yourself
Turn your PDF publications into a flip-book with our unique Google optimized e-Paper software.
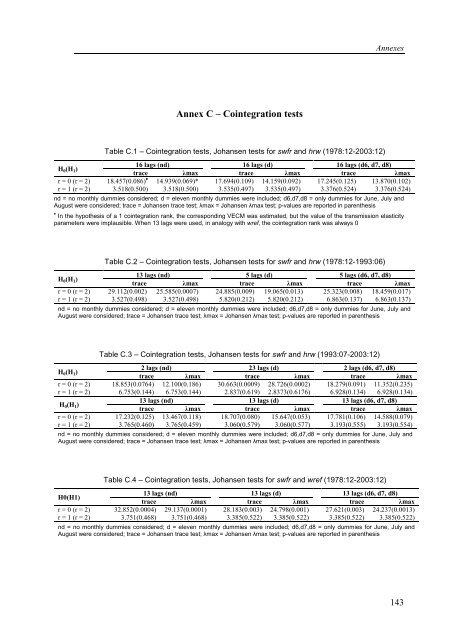
Annex C – Cointegration tests<br />
Table C.1 – Cointegration tests, Johansen tests for swfr and hrw (1978:12-2003:12)<br />
Annexes<br />
H0(H1) 16 lags (nd)<br />
trace λmax<br />
16 lags (d)<br />
trace λmax<br />
16 lags (d6, d7, d8)<br />
trace λmax<br />
r = 0 (r = 2) 18.457(0.086) ♦ 14.939(0.069)* 17.694(0.109) 14.159(0.092) 17.245(0.125) 13.870(0.102)<br />
r = 1 (r = 2) 3.518(0.500) 3.518(0.500) 3.535(0.497) 3.535(0.497) 3.376(0.524) 3.376(0.524)<br />
nd = no monthly dummies considered; d = eleven monthly dummies were included; d6,d7,d8 = only dummies for June, July and<br />
August were considered; trace = Johansen trace test; λmax = Johansen λmax test; p-values are reported in parenthesis<br />
♦ In the hypothesis of a 1 cointegration rank, the corresponding VECM was estimated, but the value of the transmission elasticity<br />
parameters were implausible. When 13 lags were used, in analogy with wref, the cointegration rank was always 0<br />
Table C.2 – Cointegration tests, Johansen tests for swfr and hrw (1978:12-1993:06)<br />
H0(H1) 13 lags (nd)<br />
trace λmax<br />
5 lags (d)<br />
trace λmax<br />
5 lags (d6, d7, d8)<br />
trace λmax<br />
r = 0 (r = 2) 29.112(0.002) 25.585(0.0007) 24.885(0.009) 19.065(0.013) 25.323(0.008) 18.459(0.017)<br />
r = 1 (r = 2) 3.527(0.498) 3.527(0.498) 5.820(0.212) 5.820(0.212) 6.863(0.137) 6.863(0.137)<br />
nd = no monthly dummies considered; d = eleven monthly dummies were included; d6,d7,d8 = only dummies for June, July and<br />
August were considered; trace = Johansen trace test; λmax = Johansen λmax test; p-values are reported in parenthesis<br />
Table C.3 – Cointegration tests, Johansen tests for swfr and hrw (1993:07-2003:12)<br />
H0(H1) 2 lags (nd)<br />
trace λmax<br />
23 lags (d)<br />
trace λmax<br />
2 lags (d6, d7, d8)<br />
trace λmax<br />
r = 0 (r = 2) 18.853(0.0764) 12.100(0.186) 30.663(0.0009) 28.726(0.0002) 18.279(0.091) 11.352(0.235)<br />
r = 1 (r = 2) 6.753(0.144) 6.753(0.144) 2.837(0.619) 2.8373(0.6176) 6.928(0.134) 6.928(0.134)<br />
H0(H1) 13 lags (nd)<br />
trace λmax<br />
13 lags (d)<br />
trace λmax<br />
13 lags (d6, d7, d8)<br />
trace λmax<br />
r = 0 (r = 2) 17.232(0.125) 13.467(0.118) 18.707(0.080) 15.647(0.053) 17.781(0.106) 14.588(0.079)<br />
r = 1 (r = 2) 3.765(0.460) 3.765(0.459) 3.060(0.579) 3.060(0.577) 3.193(0.555) 3.193(0.554)<br />
nd = no monthly dummies considered; d = eleven monthly dummies were included; d6,d7,d8 = only dummies for June, July and<br />
August were considered; trace = Johansen trace test; λmax = Johansen λmax test; p-values are reported in parenthesis<br />
Table C.4 – Cointegration tests, Johansen tests for swfr and wref (1978:12-2003:12)<br />
H0(H1)<br />
13 lags (nd)<br />
trace λmax<br />
13 lags (d)<br />
trace λmax<br />
13 lags (d6, d7, d8)<br />
trace λmax<br />
r = 0 (r = 2) 32.852(0.0004) 29.137(0.0001) 28.183(0.003) 24.798(0.001) 27.621(0.003) 24.237(0.0013)<br />
r = 1 (r = 2) 3.751(0.468) 3.751(0.468) 3.385(0.522) 3.385(0.522) 3.385(0.522) 3.385(0.522)<br />
nd = no monthly dummies considered; d = eleven monthly dummies were included; d6,d7,d8 = only dummies for June, July and<br />
August were considered; trace = Johansen trace test; λmax = Johansen λmax test; p-values are reported in parenthesis<br />
143