TESTING INTERNATIONAL PRICE TRANSMISSION UNDER ...
TESTING INTERNATIONAL PRICE TRANSMISSION UNDER ...
TESTING INTERNATIONAL PRICE TRANSMISSION UNDER ...

You also want an ePaper? Increase the reach of your titles
YUMPU automatically turns print PDFs into web optimized ePapers that Google loves.
α<br />
LM test<br />
ARCH(13)<br />
Empirical Analysis: Cointegration Models Accounting for Policy Regime Changes<br />
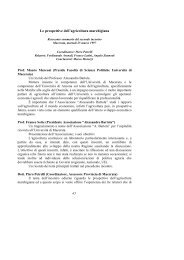
Table 5.2 Model 1 estimates for swfr and wref, 1978:12-2003:12<br />
∆swfr ∆wref Cointegration vector<br />
-0.093***<br />
(0.030)<br />
0.207<br />
(p-value 0.999)<br />
2.371<br />
(p-value 0.999)<br />
0.064**<br />
(0.030)<br />
0.201<br />
(p-value 0.999)<br />
3.402<br />
(p-value 0.996)<br />
swfr = − 0 . 397+<br />
1.<br />
054*<br />
* * wref<br />
t<br />
( 0.<br />
670)<br />
( 0.<br />
131)<br />
cost = 0 χ 2 = 0.333 (p-value 0.564)<br />
β wref = 1 χ 2 = 0.161 (p-value 0.688)<br />
β wref = 0 χ 2 = 18.886 (p-value 0)<br />
Standard errors are reported in parenthesis<br />
LM test: Lagrange Multiplier test with the null hypothesis of no-autocorrelation<br />
*significant at 10%; **significant at 5%; *** significant at 1% for the null hypothesis of zero coefficients (#, ##<br />
and ### respectively if for βwref the null hypothesis of equal to one is rejected)<br />
The cointegration relation is swfrt = -0.397 + 1.054 wreft. The imposition of a 1<br />
price transmission elasticity coefficient is not rejected (χ 2 = 0.161; p-value 0.688).<br />
The constant term is not significantly different from zero (χ 2 = 0.333; p-value<br />
0.564). Adjustment coefficients have the expected sign and are both significant.<br />
The residuals from the cointegration relationship show a stationary behaviour<br />
(figure 5.2). We can see that three major deviations from the long run relation,<br />
corresponding to major peaks of the error correction term, occurred in 1985, 1996<br />
and 2002; in these months the French price was low, as explained before, because<br />
of the use of export taxes or of the specific situation of 2001/2002, when large<br />
inflows of products depressed domestic EU prices. Since these are accounted for<br />
in the short-run dynamics of the system but not inside the cointegration vector 69 ,<br />
what we observe is an increase in the disequilibrium term. To this point, the<br />
empirical findings confirm our expectations: the French price is linked to a series<br />
constituted by the maximum between the intervention and the US price, and the<br />
price transmission elasticity is very close to one.<br />
To explore more in depth how this relation has possibly changed in time, the<br />
analysis has first been repeated in the sub sample 1978:12-1993:06. Here, wref is<br />
almost always constituted by the intervention price, which is higher than the US<br />
price 145 months over a total of 175 (83% of the total number of observations).<br />
Indeed, up to the MacSharry reform intervention price were normally set above<br />
the world price.<br />
swfr is cointegrated with hrw, but the price transmission elasticity coefficient in<br />
the cointegration vector is very low (see table 5.3, Model 1a, where “a” indicates<br />
that estimates refer to the first sub-sample) 70 .<br />
69 This could be done by cointegration techniques accounting for structural breaks (see chapter 6).<br />
70 The VECM was estimated with 5 lags (optimal number according to the AIC when monthly dummies were<br />
included) and with the monthly dummies for June, July, and August only, which allowed getting better<br />
t<br />
81