Gudiyattam Gudiyattam Town - Municipal
Gudiyattam Gudiyattam Town - Municipal
Gudiyattam Gudiyattam Town - Municipal
Create successful ePaper yourself
Turn your PDF publications into a flip-book with our unique Google optimized e-Paper software.
Annexure Final Report: <strong>Gudiyattam</strong> <strong>Municipal</strong>ity<br />
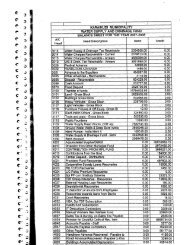
Annexure IX - s: Key Financial Indicators<br />
Indicators Value Unit<br />
A Resource Mobilization<br />
1 Per Capita Income 489 Rs. p.a<br />
2 Sources of Funds<br />
a) Share of Own Sources in Total Revenue Income (RI) 75.43 %<br />
b) Share of Property Tax in Total Revenue Income 23.18 %<br />
c) Share of Revenue Grants & Subsidies in Total RI 24.57 %<br />
3 Growth in Revenue Income 20.85 % p.a.<br />
4 Growth in Own Sources of Revenue Income 76.21 %<br />
5 Per Capita Own Income 369 Rs. p.a<br />
B Fund Application<br />
1 Per Capita Expenditure 542 Rs. p.a<br />
2 Uses of Funds<br />
a) Share of Establishment Expenditure in Total RE 41.71 %<br />
b) Share of O&M Expenditure in Total Revenue Expenditure 17.05 %<br />
c) Share of Establishment Expenditure to Total RI 44.06 %<br />
3 Growth in Establishment Expenditure 2.62 %<br />
4 Growth in O&M Expenditure 15.57 %<br />
5 Growth in Total Revenue Expenditure 5.23 % p.a.<br />
C Liability Management<br />
1 Per Capita Liability<br />
a) Outstanding debt per Capita 646 Rs.<br />
b) Outstanding Non-Debt Liability per Capita - Rs.<br />
c) Total Outstanding Liability Per Capita 646 Rs.<br />
2 As a Proportion of Property Tax Current Demand<br />
a) Outstanding Debt as % of P.T Demand 569 %<br />
b) Outstanding Non-Debt Liability as % of P.T Demand -<br />
c) Total Outstanding Liability as % of P.T Demand 569 %<br />
3 As a Proportion of Property Tax Own Revenue Income<br />
a) Outstanding Debt as % of Own Revenue Sources 175 %<br />
b) O/s Non-Debt Liability as % of Own Revenue Sources -<br />
c) Total Outstanding Liability as % Own Revenue Sources 175 %<br />
4 Non-Debt Liability as % of Total Liability -<br />
5 Debt Servicing Ratio (D/S Revenue Income) 106 %<br />
D Performance Indicators<br />
1 Operating Ratio 91 %<br />
2 Growth in Per Capita Own Income 17.00 %<br />
3 Growth in Per Capita Grant 1.41 %<br />
4 Growth in Per Capita Total Revenue Income 11.38 %<br />
5 Growth in Per Capita Establishment Expenditure 0.50 %<br />
6 Growth in Per Capita O&M Expenditure 12.22 %<br />
7 Growth in Per Capita Revenue Expenditure 2.85 %<br />
. - 200 -<br />
Voyants Solutions Private Limited


