

Gudiyattam Gudiyattam Town - Municipal
Gudiyattam Gudiyattam Town - Municipal
Gudiyattam Gudiyattam Town - Municipal

Create successful ePaper yourself
Turn your PDF publications into a flip-book with our unique Google optimized e-Paper software.
Chapter ñ 9 Final Report: <strong>Gudiyattam</strong> <strong>Municipal</strong>ity<br />
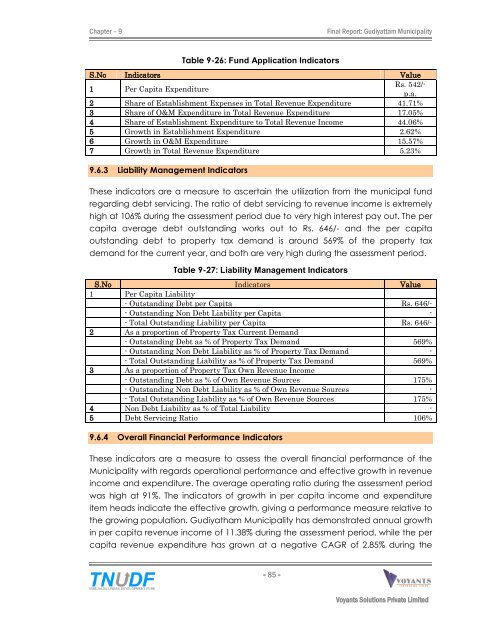
Table 9-26: Fund Application Indicators<br />
S.No Indicators Value<br />
1 Per Capita Expenditure<br />
Rs. 542/p.a.<br />
2 Share of Establishment Expenses in Total Revenue Expenditure 41.71%<br />
3 Share of O&M Expenditure in Total Revenue Expenditure 17.05%<br />
4 Share of Establishment Expenditure to Total Revenue Income 44.06%<br />
5 Growth in Establishment Expenditure 2.62%<br />
6 Growth in O&M Expenditure 15.57%<br />
7 Growth in Total Revenue Expenditure 5.23%<br />
9.6.3 Liability Management Indicators<br />
These indicators are a measure to ascertain the utilization from the municipal fund<br />
regarding debt servicing. The ratio of debt servicing to revenue income is extremely<br />
high at 106% during the assessment period due to very high interest pay out. The per<br />
capita average debt outstanding works out to Rs. 646/- and the per capita<br />
outstanding debt to property tax demand is around 569% of the property tax<br />
demand for the current year, and both are very high during the assessment period.<br />
Table 9-27: Liability Management Indicators<br />
S.No Indicators Value<br />
1 Per Capita Liability<br />
- Outstanding Debt per Capita Rs. 646/-<br />
- Outstanding Non Debt Liability per Capita -<br />
- Total Outstanding Liability per Capita Rs. 646/-<br />
2 As a proportion of Property Tax Current Demand<br />
- Outstanding Debt as % of Property Tax Demand 569%<br />
- Outstanding Non Debt Liability as % of Property Tax Demand -<br />
- Total Outstanding Liability as % of Property Tax Demand 569%<br />
3 As a proportion of Property Tax Own Revenue Income<br />
- Outstanding Debt as % of Own Revenue Sources 175%<br />
- Outstanding Non Debt Liability as % of Own Revenue Sources -<br />
- Total Outstanding Liability as % of Own Revenue Sources 175%<br />
4 Non Debt Liability as % of Total Liability -<br />
5 Debt Servicing Ratio 106%<br />
9.6.4 Overall Financial Performance Indicators<br />
These indicators are a measure to assess the overall financial performance of the<br />
<strong>Municipal</strong>ity with regards operational performance and effective growth in revenue<br />
income and expenditure. The average operating ratio during the assessment period<br />
was high at 91%. The indicators of growth in per capita income and expenditure<br />
item heads indicate the effective growth, giving a performance measure relative to<br />
the growing population. Gudiyatham <strong>Municipal</strong>ity has demonstrated annual growth<br />
in per capita revenue income of 11.38% during the assessment period, while the per<br />
capita revenue expenditure has grown at a negative CAGR of 2.85% during the<br />
- 85 -<br />
Voyants Solutions Private Limited


