

Sample A: Cover Page of Thesis, Project, or Dissertation Proposal
Sample A: Cover Page of Thesis, Project, or Dissertation Proposal
Sample A: Cover Page of Thesis, Project, or Dissertation Proposal

Create successful ePaper yourself
Turn your PDF publications into a flip-book with our unique Google optimized e-Paper software.
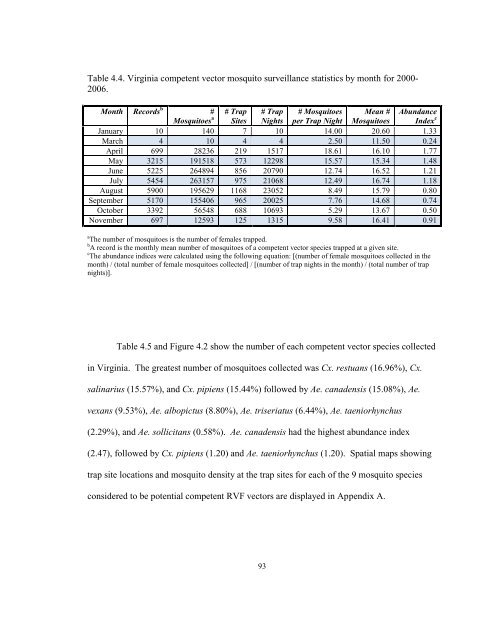
Table 4.4. Virginia competent vect<strong>or</strong> mosquito surveillance statistics by month f<strong>or</strong> 2000-<br />
2006.<br />
Month Rec<strong>or</strong>ds b #<br />
Mosquitoes a<br />
# Trap # Trap # Mosquitoes Mean # Abundance<br />
Sites Nights per Trap Night Mosquitoes Index c<br />
January 10 140 7 10 14.00 20.60 1.33<br />
March 4 10 4 4 2.50 11.50 0.24<br />
April 699 28236 219 1517 18.61 16.10 1.77<br />
May 3215 191518 573 12298 15.57 15.34 1.48<br />
June 5225 264894 856 20790 12.74 16.52 1.21<br />
July 5454 263157 975 21068 12.49 16.74 1.18<br />
August 5900 195629 1168 23052 8.49 15.79 0.80<br />
September 5170 155406 965 20025 7.76 14.68 0.74<br />
October 3392 56548 688 10693 5.29 13.67 0.50<br />
November 697 12593 125 1315 9.58 16.41 0.91<br />
a The number <strong>of</strong> mosquitoes is the number <strong>of</strong> females trapped.<br />
b A rec<strong>or</strong>d is the monthly mean number <strong>of</strong> mosquitoes <strong>of</strong> a competent vect<strong>or</strong> species trapped at a given site.<br />
c The abundance indices were calculated using the following equation: [(number <strong>of</strong> female mosquitoes collected in the<br />
month) / (total number <strong>of</strong> female mosquitoes collected] / [(number <strong>of</strong> trap nights in the month) / (total number <strong>of</strong> trap<br />
nights)].<br />
Table 4.5 and Figure 4.2 show the number <strong>of</strong> each competent vect<strong>or</strong> species collected<br />
in Virginia. The greatest number <strong>of</strong> mosquitoes collected was Cx. restuans (16.96%), Cx.<br />
salinarius (15.57%), and Cx. pipiens (15.44%) followed by Ae. canadensis (15.08%), Ae.<br />
vexans (9.53%), Ae. albopictus (8.80%), Ae. triseriatus (6.44%), Ae. taeni<strong>or</strong>hynchus<br />
(2.29%), and Ae. sollicitans (0.58%). Ae. canadensis had the highest abundance index<br />
(2.47), followed by Cx. pipiens (1.20) and Ae. taeni<strong>or</strong>hynchus (1.20). Spatial maps showing<br />
trap site locations and mosquito density at the trap sites f<strong>or</strong> each <strong>of</strong> the 9 mosquito species<br />
considered to be potential competent RVF vect<strong>or</strong>s are displayed in Appendix A.<br />
93

![[Sample B: Approval/Signature Sheet] - George Mason University](https://img.yumpu.com/21978828/1/190x245/sample-b-approval-signature-sheet-george-mason-university.jpg?quality=85)


![[Sample B: Approval/Signature Sheet] - George Mason University](https://img.yumpu.com/18694905/1/190x245/sample-b-approval-signature-sheet-george-mason-university.jpg?quality=85)


![[Sample B: Approval/Signature Sheet] - George Mason University](https://img.yumpu.com/18694552/1/189x260/sample-b-approval-signature-sheet-george-mason-university.jpg?quality=85)


![[Sample B: Approval/Signature Sheet] - George Mason University](https://img.yumpu.com/18694474/1/190x245/sample-b-approval-signature-sheet-george-mason-university.jpg?quality=85)