

Sample A: Cover Page of Thesis, Project, or Dissertation Proposal
Sample A: Cover Page of Thesis, Project, or Dissertation Proposal
Sample A: Cover Page of Thesis, Project, or Dissertation Proposal

Create successful ePaper yourself
Turn your PDF publications into a flip-book with our unique Google optimized e-Paper software.
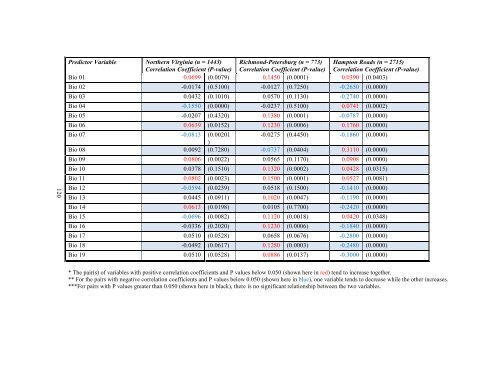
120<br />
Predict<strong>or</strong> Variable N<strong>or</strong>thern Virginia (n = 1443) Richmond-Petersburg (n = 773) Hampton Roads (n = 2715)<br />
C<strong>or</strong>relation Coefficient (P-value) C<strong>or</strong>relation Coefficient (P-value) C<strong>or</strong>relation Coefficient (P-value)<br />
Bio 01 0.0699 (0.0079) 0.1450 (0.0001) 0.0390 (0.0403)<br />
Bio 02 -0.0174 (0.5100) -0.0127 (0.7250) -0.2650 (0.0000)<br />
Bio 03 0.0432 (0.1010) 0.0570 (0.1130) -0.2740 (0.0000)<br />
Bio 04 -0.1550 (0.0000) -0.0237 (0.5100) 0.0741 (0.0002)<br />
Bio 05 -0.0207 (0.4320) 0.1380 (0.0001) -0.0787 (0.0000)<br />
Bio 06 0.0639 (0.0152) 0.1230 (0.0006) 0.1760 (0.0000)<br />
Bio 07 -0.0813 (0.00201<br />
)<br />
-0.0275 (0.4450) -0.1860 (0.0000)<br />
Bio 08 0.0092 (0.7280) -0.0737 (0.0404) 0.3110 (0.0000)<br />
Bio 09 0.0806 (0.0022) 0.0565 (0.1170) 0.0908 (0.0000)<br />
Bio 10 0.0378 (0.1510) 0.1320 (0.0002) 0.0428 (0.0315)<br />
Bio 11 0.0802 (0.0023) 0.1500 (0.0001) 0.0527 (0.0081)<br />
Bio 12 -0.0594 (0.0239) 0.0518 (0.1500) -0.1410 (0.0000)<br />
Bio 13 0.0445 (0.0911) 0.1020 (0.0047) -0.1190 (0.0000)<br />
Bio 14 0.0613 (0.0198) 0.0105 (0.7700) -0.2420 (0.0000)<br />
Bio 15 -0.0696 (0.0082) 0.1120 (0.0018) 0.0420 (0.0348)<br />
Bio 16 -0.0336 (0.2020) 0.1230 (0.0006) -0.1840 (0.0000)<br />
Bio 17 0.0510 (0.0528) 0.0658 (0.0676) -0.2800 (0.0000)<br />
Bio 18 -0.0492 (0.0617) 0.1280 (0.0003) -0.2480 (0.0000)<br />
Bio 19 0.0510 (0.0528) 0.0886 (0.0137) -0.3000 (0.0000)<br />
* The pair(s) <strong>of</strong> variables with positive c<strong>or</strong>relation coefficients and P values below 0.050 (shown here in red) tend to increase together.<br />
** F<strong>or</strong> the pairs with negative c<strong>or</strong>relation coefficients and P values below 0.050 (shown here in blue), one variable tends to decrease while the other increases.<br />
***F<strong>or</strong> pairs with P values greater than 0.050 (shown here in black), there is no significant relationship between the two variables.

![[Sample B: Approval/Signature Sheet] - George Mason University](https://img.yumpu.com/21978828/1/190x245/sample-b-approval-signature-sheet-george-mason-university.jpg?quality=85)


![[Sample B: Approval/Signature Sheet] - George Mason University](https://img.yumpu.com/18694905/1/190x245/sample-b-approval-signature-sheet-george-mason-university.jpg?quality=85)


![[Sample B: Approval/Signature Sheet] - George Mason University](https://img.yumpu.com/18694552/1/189x260/sample-b-approval-signature-sheet-george-mason-university.jpg?quality=85)


![[Sample B: Approval/Signature Sheet] - George Mason University](https://img.yumpu.com/18694474/1/190x245/sample-b-approval-signature-sheet-george-mason-university.jpg?quality=85)