Sample A: Cover Page of Thesis, Project, or Dissertation Proposal
Sample A: Cover Page of Thesis, Project, or Dissertation Proposal
Sample A: Cover Page of Thesis, Project, or Dissertation Proposal
Create successful ePaper yourself
Turn your PDF publications into a flip-book with our unique Google optimized e-Paper software.
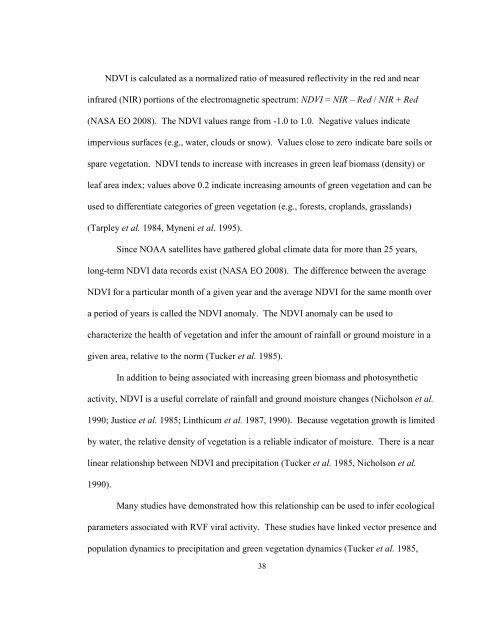
NDVI is calculated as a n<strong>or</strong>malized ratio <strong>of</strong> measured reflectivity in the red and near<br />
infrared (NIR) p<strong>or</strong>tions <strong>of</strong> the electromagnetic spectrum: NDVI = NIR – Red / NIR + Red<br />
(NASA EO 2008). The NDVI values range from -1.0 to 1.0. Negative values indicate<br />
impervious surfaces (e.g., water, clouds <strong>or</strong> snow). Values close to zero indicate bare soils <strong>or</strong><br />
spare vegetation. NDVI tends to increase with increases in green leaf biomass (density) <strong>or</strong><br />
leaf area index; values above 0.2 indicate increasing amounts <strong>of</strong> green vegetation and can be<br />
used to differentiate categ<strong>or</strong>ies <strong>of</strong> green vegetation (e.g., f<strong>or</strong>ests, croplands, grasslands)<br />
(Tarpley et al. 1984, Myneni et al. 1995).<br />
Since NOAA satellites have gathered global climate data f<strong>or</strong> m<strong>or</strong>e than 25 years,<br />
long-term NDVI data rec<strong>or</strong>ds exist (NASA EO 2008). The difference between the average<br />
NDVI f<strong>or</strong> a particular month <strong>of</strong> a given year and the average NDVI f<strong>or</strong> the same month over<br />
a period <strong>of</strong> years is called the NDVI anomaly. The NDVI anomaly can be used to<br />
characterize the health <strong>of</strong> vegetation and infer the amount <strong>of</strong> rainfall <strong>or</strong> ground moisture in a<br />
given area, relative to the n<strong>or</strong>m (Tucker et al. 1985).<br />
In addition to being associated with increasing green biomass and photosynthetic<br />
activity, NDVI is a useful c<strong>or</strong>relate <strong>of</strong> rainfall and ground moisture changes (Nicholson et al.<br />
1990; Justice et al. 1985; Linthicum et al. 1987, 1990). Because vegetation growth is limited<br />
by water, the relative density <strong>of</strong> vegetation is a reliable indicat<strong>or</strong> <strong>of</strong> moisture. There is a near<br />
linear relationship between NDVI and precipitation (Tucker et al. 1985, Nicholson et al.<br />
1990).<br />
Many studies have demonstrated how this relationship can be used to infer ecological<br />
parameters associated with RVF viral activity. These studies have linked vect<strong>or</strong> presence and<br />
population dynamics to precipitation and green vegetation dynamics (Tucker et al. 1985,<br />
38


![[Sample B: Approval/Signature Sheet] - George Mason University](https://img.yumpu.com/21978828/1/190x245/sample-b-approval-signature-sheet-george-mason-university.jpg?quality=85)
![[Sample B: Approval/Signature Sheet] - George Mason University](https://img.yumpu.com/18694905/1/190x245/sample-b-approval-signature-sheet-george-mason-university.jpg?quality=85)
![[Sample B: Approval/Signature Sheet] - George Mason University](https://img.yumpu.com/18694552/1/189x260/sample-b-approval-signature-sheet-george-mason-university.jpg?quality=85)
![[Sample B: Approval/Signature Sheet] - George Mason University](https://img.yumpu.com/18694474/1/190x245/sample-b-approval-signature-sheet-george-mason-university.jpg?quality=85)