Sample A: Cover Page of Thesis, Project, or Dissertation Proposal
Sample A: Cover Page of Thesis, Project, or Dissertation Proposal
Sample A: Cover Page of Thesis, Project, or Dissertation Proposal
You also want an ePaper? Increase the reach of your titles
YUMPU automatically turns print PDFs into web optimized ePapers that Google loves.
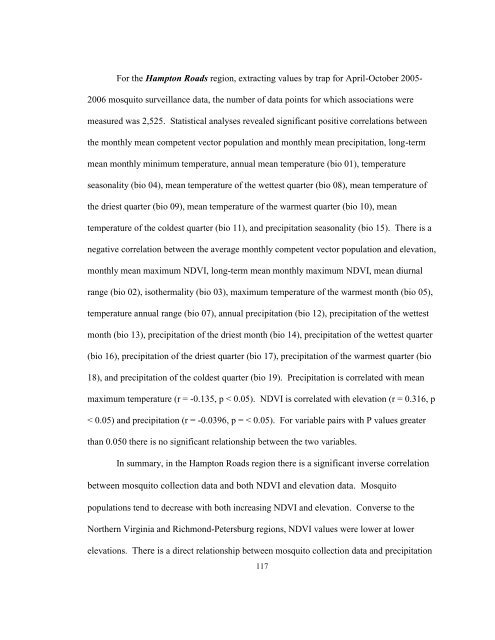
F<strong>or</strong> the Hampton Roads region, extracting values by trap f<strong>or</strong> April-October 2005-<br />
2006 mosquito surveillance data, the number <strong>of</strong> data points f<strong>or</strong> which associations were<br />
measured was 2,525. Statistical analyses revealed significant positive c<strong>or</strong>relations between<br />
the monthly mean competent vect<strong>or</strong> population and monthly mean precipitation, long-term<br />
mean monthly minimum temperature, annual mean temperature (bio 01), temperature<br />
seasonality (bio 04), mean temperature <strong>of</strong> the wettest quarter (bio 08), mean temperature <strong>of</strong><br />
the driest quarter (bio 09), mean temperature <strong>of</strong> the warmest quarter (bio 10), mean<br />
temperature <strong>of</strong> the coldest quarter (bio 11), and precipitation seasonality (bio 15). There is a<br />
negative c<strong>or</strong>relation between the average monthly competent vect<strong>or</strong> population and elevation,<br />
monthly mean maximum NDVI, long-term mean monthly maximum NDVI, mean diurnal<br />
range (bio 02), isothermality (bio 03), maximum temperature <strong>of</strong> the warmest month (bio 05),<br />
temperature annual range (bio 07), annual precipitation (bio 12), precipitation <strong>of</strong> the wettest<br />
month (bio 13), precipitation <strong>of</strong> the driest month (bio 14), precipitation <strong>of</strong> the wettest quarter<br />
(bio 16), precipitation <strong>of</strong> the driest quarter (bio 17), precipitation <strong>of</strong> the warmest quarter (bio<br />
18), and precipitation <strong>of</strong> the coldest quarter (bio 19). Precipitation is c<strong>or</strong>related with mean<br />
maximum temperature (r = -0.135, p < 0.05). NDVI is c<strong>or</strong>related with elevation (r = 0.316, p<br />
< 0.05) and precipitation (r = -0.0396, p = < 0.05). F<strong>or</strong> variable pairs with P values greater<br />
than 0.050 there is no significant relationship between the two variables.<br />
In summary, in the Hampton Roads region there is a significant inverse c<strong>or</strong>relation<br />
between mosquito collection data and both NDVI and elevation data. Mosquito<br />
populations tend to decrease with both increasing NDVI and elevation. Converse to the<br />
N<strong>or</strong>thern Virginia and Richmond-Petersburg regions, NDVI values were lower at lower<br />
elevations. There is a direct relationship between mosquito collection data and precipitation<br />
117


![[Sample B: Approval/Signature Sheet] - George Mason University](https://img.yumpu.com/21978828/1/190x245/sample-b-approval-signature-sheet-george-mason-university.jpg?quality=85)
![[Sample B: Approval/Signature Sheet] - George Mason University](https://img.yumpu.com/18694905/1/190x245/sample-b-approval-signature-sheet-george-mason-university.jpg?quality=85)
![[Sample B: Approval/Signature Sheet] - George Mason University](https://img.yumpu.com/18694552/1/189x260/sample-b-approval-signature-sheet-george-mason-university.jpg?quality=85)
![[Sample B: Approval/Signature Sheet] - George Mason University](https://img.yumpu.com/18694474/1/190x245/sample-b-approval-signature-sheet-george-mason-university.jpg?quality=85)