- Page 1 and 2:
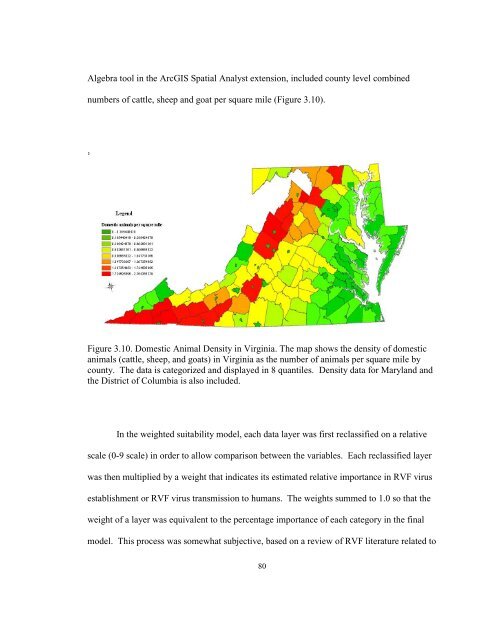
Using Remote Sensing, Ecological Ni
- Page 3 and 4:
DEDICATION This is dedicated to my
- Page 5 and 6:
Lastly, I would like to thank all o
- Page 7 and 8:
CHAPTER 4: RESULTS ................
- Page 9 and 10:
LIST OF FIGURES Figures Page 2.1 Kn
- Page 11 and 12:
AUC - Area Under the Curve LIST OF
- Page 13 and 14:
ABSTRACT USING REMOTE SENSING, ECOL
- Page 15 and 16:
Keywords Rift Valley fever, risk as
- Page 17 and 18:
systematically inventory and monito
- Page 19 and 20:
populations), human demographics an
- Page 21 and 22:
The geographic distribution of pote
- Page 23 and 24:
human and animal health, economic l
- Page 25 and 26:
1.8 ORGANIZATION OF DISSERTATION Th
- Page 27 and 28:
(e.g., ether, chloroform), detergen
- Page 29 and 30:
(Imam et al. 1979, Davies and Marti
- Page 31 and 32:
have demonstrated that wild ruminan
- Page 33 and 34:
flooding of grassland depressions c
- Page 35 and 36:
and created mosquito breeding habit
- Page 37 and 38:
may transmit the RVF virus mechanic
- Page 39 and 40:
virus during inter-epizootic period
- Page 41 and 42:
grown by nearly 9% per year (Tatem
- Page 43 and 44: animals during RVF outbreaks or col
- Page 45 and 46: sufficient and continued contact be
- Page 47 and 48: Environmental factors are directly
- Page 49 and 50: animals could arrive in an uninfect
- Page 51 and 52: GIS technology and RS data has been
- Page 53 and 54: NDVI is calculated as a normalized
- Page 55 and 56: In September 2006, the RVF forecast
- Page 57 and 58: In the U.S. RVF is not present and
- Page 59 and 60: changes in mosquito populations in
- Page 61 and 62: hosts that are widely dispersed thr
- Page 63 and 64: mountain range of the Appalachian M
- Page 65 and 66: The land area of Hampton Roads incl
- Page 67 and 68: 52 Table 3.1. Primary data sets and
- Page 69 and 70: Table 3.2. Sources of Virginia mosq
- Page 71 and 72: Figure 3.3. Cattle Density in Virgi
- Page 73 and 74: Figure 3.6. 2006 Deer Abundance Est
- Page 75 and 76: Land-Cover Global land-cover data a
- Page 77 and 78: Figure 3.8. Virginia Land-cover Nor
- Page 79 and 80: Figure 3.9. June 2006 Normalized Di
- Page 81 and 82: Table 3.4. Worldclim interpolated c
- Page 83 and 84: 3.2.5 DATA PROCESSING All data sets
- Page 85 and 86: normalize differences among surveil
- Page 87 and 88: for three regions of Virginia - Nor
- Page 89 and 90: Correlation analyses The Pearson‟
- Page 91 and 92: of maximum entropy (i.e., that is m
- Page 93: When test data are available, MaxEn
- Page 97 and 98: CHAPTER 4. RESULTS 4.1 POTENTIAL RV
- Page 99 and 100: 1. If a native U.S. vector can tran
- Page 101 and 102: Bioecology of Species Selected for
- Page 103 and 104: ditches, animal waste lagoons, and
- Page 105 and 106: 90 Mosquito Species Typical Habitat
- Page 107 and 108: The majority of mosquitoes were col
- Page 109 and 110: Table 4.5. Virginia competent vecto
- Page 111 and 112: Table 4.6. Virginia competent vecto
- Page 113 and 114: Table 4.7. Virginia competent vecto
- Page 115 and 116: 4.3 MOSQUITO DENSITY CORRELATIONS W
- Page 117 and 118: 102 Table 4.8. Mean and range of ea
- Page 119 and 120: Regional graphical analyses In Figu
- Page 121 and 122: Population Density (mean daily trap
- Page 123 and 124: Population Density (mean daily trap
- Page 125 and 126: Competent vector species were plott
- Page 127 and 128: Population Density (mean daily trap
- Page 129 and 130: Predictor correlation analyses Whil
- Page 131 and 132: temperature of the coldest month (b
- Page 133 and 134: data. Mosquito populations tend to
- Page 135 and 136: 120 Predictor Variable Northern Vir
- Page 137 and 138: 122 was 0.003. At this threshold, t
- Page 139 and 140: 124 The Jackknife test of variable
- Page 141 and 142: 126 4.5 RISK OF RVF ESTABLISHMENT A
- Page 143 and 144: 128 The weighted suitability modeli
- Page 145 and 146:
CHAPTER 5. DISCUSSION 5.1 ENVIRONME
- Page 147 and 148:
heavily on rainfall as do the predo
- Page 149 and 150:
5.2 ENVIRONMENTAL-CLIMATIC VARIABLE
- Page 151 and 152:
study; predicted suitable habitat w
- Page 153 and 154:
state. The high risk in this region
- Page 155 and 156:
The results of this study indicate
- Page 157 and 158:
It is recommended that species dive
- Page 159 and 160:
individually and over smaller time
- Page 161 and 162:
146 APPENDIX A: RVF COMPETENT VECTO
- Page 163 and 164:
148 Figure A.3. Ae. sollicitans dis
- Page 165 and 166:
150 Figure A.5. Ae. triseriatus dis
- Page 167 and 168:
152 Figure A.7. Cx. pipiens distrib
- Page 169 and 170:
154 Figure A.9. Cx. salinarius dist
- Page 171 and 172:
Desiccation - drying. Diapause - ph
- Page 173 and 174:
Larva - immature form of certain or
- Page 175 and 176:
Vector competence - the vector comp
- Page 177 and 178:
REFERENCES Ackerman GA, Giroux J. A
- Page 179 and 180:
Brown H, Duik-Wasser M, Andreadis T
- Page 181 and 182:
Diallo M, Nabeth P, Ba K, Sall AA,
- Page 183 and 184:
Glass GE, Cheek JE, Patz JA, Shield
- Page 185 and 186:
Komar O, Robbins MB, Klenk K, Blitv
- Page 187 and 188:
NASA Earth Observatory (EO) Measuri
- Page 189 and 190:
Phillips SJ, Dudík M, Schapire RE.
- Page 191 and 192:
Tatem AJ, Hay SI, Rogers DJ. Global
- Page 193 and 194:
WHO Disease Outbreak News [Internet


![[Sample B: Approval/Signature Sheet] - George Mason University](https://img.yumpu.com/21978828/1/190x245/sample-b-approval-signature-sheet-george-mason-university.jpg?quality=85)


![[Sample B: Approval/Signature Sheet] - George Mason University](https://img.yumpu.com/18694905/1/190x245/sample-b-approval-signature-sheet-george-mason-university.jpg?quality=85)


![[Sample B: Approval/Signature Sheet] - George Mason University](https://img.yumpu.com/18694552/1/189x260/sample-b-approval-signature-sheet-george-mason-university.jpg?quality=85)


![[Sample B: Approval/Signature Sheet] - George Mason University](https://img.yumpu.com/18694474/1/190x245/sample-b-approval-signature-sheet-george-mason-university.jpg?quality=85)