Untitled
Untitled
Untitled

Create successful ePaper yourself
Turn your PDF publications into a flip-book with our unique Google optimized e-Paper software.
European Journal of Clinical Nutrition<br />
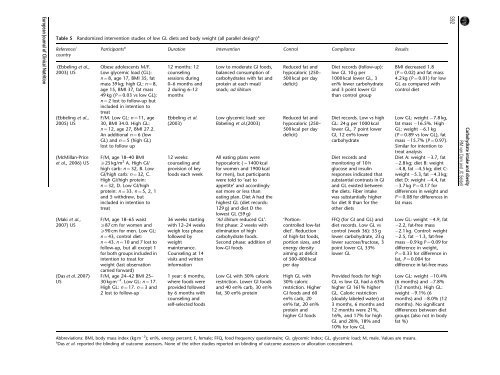
Table 5 Randomized intervention studies of low GL diets and body weight (all parallel design) a<br />
Reference/<br />
country<br />
(Ebbeling et al.,<br />
2003) US<br />
(Ebbeling et al.,<br />
2005) US<br />
(McMillan-Price<br />
et al., 2006) US<br />
(Maki et al.,<br />
2007) US<br />
(Das et al. 2007)<br />
US<br />
Participants a<br />
Obese adolescents M/F.<br />
Low glycemic load (GL):<br />
n ¼ 8, age 17, BMI 35, fat<br />
mass 39 kg; high GL: n ¼ 8,<br />
age 15, BMI 37, fat mass<br />
49 kg (P ¼ 0.03 vs low GL);<br />
n ¼ 2 lost to follow-up but<br />
included in intention to<br />
treat<br />
F/M. Low GL: n ¼ 11, age<br />
30, BMI 34.0. High GL:<br />
n ¼ 12, age 27, BMI 27.2.<br />
An additional n ¼ 6 (low<br />
GL) and n ¼ 5 (high GL)<br />
lost to follow up<br />
F/M, age 18–40 BMI<br />
X25 kg/m 2 A. High GI/<br />
high carb: n¼ 32, B. Low<br />
GI/high carb: n¼ 32, C.<br />
High GI/high protein:<br />
n ¼ 32, D. Low GI/high<br />
protein: n ¼ 33. n ¼ 5, 2, 1<br />
and 5 withdrew, but<br />
included in intention to<br />
treat<br />
F/M, age 18–65 waist<br />
X87 cm for women and<br />
X90 cm for men. Low GL:<br />
n ¼ 43, control diet:<br />
n ¼ 43. n ¼ 10 and 7 lost to<br />
follow-up, but all except 1<br />
for both groups included in<br />
intention to treat for<br />
weight (last observation<br />
carried forward)<br />
F/M, age 24–42 BMI 25–<br />
30 kg m 2 . Low GL: n ¼ 17.<br />
High GL: n ¼ 17. n ¼ 3and<br />
2 lost to follow-up<br />
Duration Intervention Control Compliance Results<br />
12 months: 12<br />
counseling<br />
sessions during<br />
0–6 months and<br />
2 during 6–12<br />
months<br />
Ebbeling et al.<br />
(2003)<br />
12 weeks:<br />
counseling and<br />
provision of key<br />
foods each week<br />
36 weeks starting<br />
with 12–24 weeks<br />
weigh loss phase<br />
followed by<br />
weight<br />
maintenance.<br />
Counseling at 14<br />
visits and written<br />
information<br />
1 year: 6 months,<br />
where foods were<br />
provided followed<br />
by 6 months with<br />
counseling and<br />
self-selected foods<br />
Low to moderate GI foods,<br />
balanced consumption of<br />
carbohydrates with fat and<br />
protein at each meal/<br />
snack; ad libitum<br />
Low glycemic load: see<br />
Ebbeling et al.(2003)<br />
All eating plans were<br />
hypocaloric (B1400 kcal<br />
for women and 1900 kcal<br />
for men), but participants<br />
were told to ‘eat to<br />
appetite’ and accordingly<br />
eat more or less than<br />
eating plan. Diet A had the<br />
highest GL (diet records:<br />
129 g) and diet D the<br />
lowest GL (59 g)<br />
‘Ad libitum reduced GL’.<br />
first phase: 2 weeks with<br />
elimination of high<br />
carbohydrate foods.<br />
Second phase: addition of<br />
low-GI foods<br />
Low GL with 30% caloric<br />
restriction. Lower GI foods<br />
and 40 en% carb, 30 en%<br />
fat, 30 en% protein<br />
Reduced fat and<br />
hypocaloric (250–<br />
500 kcal per day<br />
deficit)<br />
Reduced fat and<br />
hypocaloric (250–<br />
500 kcal per day<br />
deficit)<br />
‘Portioncontrolled<br />
low-fat<br />
diet’. Reduction<br />
of high-fat foods,<br />
portion sizes, and<br />
energy density<br />
aiming at deficit<br />
of 500–800 kcal<br />
per day<br />
High GL with<br />
30% caloric<br />
restriction. Higher<br />
GI foods and 60<br />
en% carb, 20<br />
en% fat, 20 en%<br />
protein and<br />
higher GI foods<br />
Diet records (follow-up):<br />
low GL 10 g per<br />
1000 kcal lower GL, 3<br />
en% lower carbohydrate<br />
and 3 point lower GI<br />
than control group<br />
Diet records. Low vs high<br />
GL: 24 g per 1000 kcal<br />
lower GL, 7 point lower<br />
GI, 12 en% lower<br />
carbohydrate<br />
Diet records and<br />
monitoring of 10 h<br />
glucose and insulin<br />
responses indicated that<br />
substantial contrasts in GI<br />
and GL existed between<br />
the diets. Fiber intake<br />
was substantially higher<br />
for diet B than for the<br />
other diets<br />
FFQ (for GI and GL) and<br />
diet records. Low GL vs<br />
control (week 36): 55 g<br />
lower carbohydrate, 23 g<br />
lower sucrose/fructose, 3<br />
point lower GI, 33%<br />
lower GL<br />
Provided foods for high<br />
GL vs low GL had a 63%<br />
higher GI 161% higher<br />
GL. Caloric restriction<br />
(doubly labeled water) at<br />
3 months, 6 months and<br />
12 months were 21%,<br />
16%, and 17% for high<br />
GL and 28%, 18% and<br />
10% for low GL<br />
Abbreviations: BMI, body mass index (kg m 2 ); en%, energy percent; F, female; FFQ, food frequency questionnaire; GI, glycemic index; GL, glycemic load; M, male. Values are means.<br />
a Das et al. reported the blinding of outcome assessors. None of the other studies reported on blinding of outcome assessors or allocation concealment.<br />
BMI decreased 1.8<br />
(P ¼ 0.02) and fat mass<br />
4.2 kg (P ¼ 0.01) for low<br />
GL as compared with<br />
control diet<br />
Low GL: weight 7.8 kg,<br />
fat mass 16.5%. High<br />
GL: weight 6.1 kg<br />
(P ¼ 0.89 vs low GL), fat<br />
mass 15.7% (P ¼ 0.97).<br />
Similar for intention to<br />
treat analysis<br />
Diet A: weight 3.7, fat<br />
2.8 kg; diet B: weight<br />
4.8, fat 4.5 kg; diet C:<br />
weight 5.3, fat 4.3 kg;<br />
diet D: weight 4.4, fat<br />
3.7 kg P ¼ 0.17 for<br />
differences in weight and<br />
P ¼ 0.08 for differences in<br />
fat mass<br />
Low GL: weight 4.9, fat<br />
2.2, fat-free mass<br />
2.1 kg. Control: weight<br />
2.5, fat 1.3, fat-free<br />
mass 0.9 kg P ¼ 0.09 for<br />
difference in weight,<br />
P ¼ 0.33 for difference in<br />
fat, P ¼ 0.004 for<br />
difference in fat-free mass<br />
Low GL: weight 10.4%<br />
(6 months) and 7.8%<br />
(12 months). High GL:<br />
weight 9.1% (6<br />
months) and 8.0% (12<br />
months). No significant<br />
differences between diet<br />
groups (also not in body<br />
fat %)<br />
S92<br />
Carbohydrate intake and obesity<br />
RM van Dam and JC Seidell