Untitled
Untitled
Untitled

You also want an ePaper? Increase the reach of your titles
YUMPU automatically turns print PDFs into web optimized ePapers that Google loves.
S124<br />
Blood glucose iAUC (mmol/L·min)<br />
350<br />
300<br />
250<br />
200<br />
150<br />
100<br />
50<br />
0<br />
0 12.5 25 37.5 50 62.5 75<br />
Available carbohydrate (g)<br />
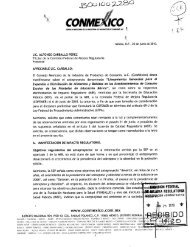
Figure 2 Blood glucose area under the curve (AUC) responses to<br />
increasing amounts of glucose and granola bar tested in 20 people.<br />
part of a low GI diet. However, watermelon only contains 5 g<br />
of carbohydrate per 100 g, thus it would have a minimal<br />
glycemic effect. GL takes into account how much carbohydrate<br />
a serving of a food contains and may be determined by<br />
indirect and direct methods.<br />
The indirect method involves multiplying the GI of a food<br />
by the amount of available carbohydrate in the portion of<br />
food consumed. This method implies that GL is directly<br />
proportional to the amount of the particular food eaten. This<br />
is perhaps counterintuitive, because the blood glucose AUC<br />
does not increase in direct proportion to the amount<br />
consumed. For example, eating six times the amount of<br />
bread results in an approximately threefold increase in AUC<br />
(Brand-Miller et al., 2003c). In other words, as the amount of<br />
food increased, the rate of increase in AUC declines, an effect<br />
shown in Figure 2 (Venn et al., 2006). Therefore, it is implicit<br />
in the calculation of GL that the AUC for both the test and<br />
the reference foods are attenuated to the same degree with<br />
increasing amounts consumed.<br />
Glycemic equivalence is a method of directly determining<br />
GL. For each subject an AUC for glucose is calculated for a<br />
range of doses of the reference food measured on different<br />
days. A standard curve is constructed for each subject with<br />
increasing amounts of the reference on the x axis with its<br />
corresponding AUC for blood glucose on the y axis (Venn<br />
et al., 2006). The AUC in response to a food consumed at any<br />
portion size, typically a usual serving, is compared to that<br />
individual’s glucose standard curve as depicted in Figure 3<br />
(Venn et al., 2006). Using this technique, glycemic equivalence<br />
is the amount of glucose that would theoretically<br />
produce the same blood glucose AUC as that particular<br />
portion size of food consumed. Major drawbacks of the direct<br />
method are increased time and cost required to determine<br />
the GL of a food. The reference must be tested at several<br />
doses in each subject and the GL of a food cannot be<br />
estimated from currently available GI values. Data from our<br />
laboratory support the premise that GL is linearly related to<br />
the amount of food consumed that is, GL calculated using<br />
European Journal of Clinical Nutrition<br />
Glycemic index and glycemic load<br />
BJ Venn and TJ Green<br />
Blood glucose iAUC (mmol/L·min)<br />
175<br />
150<br />
125<br />
100<br />
75<br />
50<br />
25<br />
0<br />
iAUC food<br />
0 12.5 25 37.5 50 62.5 75<br />
Glycaemic load (g)<br />
GL direct measure<br />
Figure 3 Example of an individual’s standard glucose curve<br />
generated using glucose doses of 12.5, 25, 50 and 75 g. A test food<br />
is consumed and the resulting area under the curve (AUC) used to<br />
impute the glycemic load. AUC refers to the area included between<br />
the baseline and incremental blood glucose points when connected<br />
by straight lines. The area under each incremental glucose curve is<br />
calculated using the trapezoid rule (Note: only areas above the<br />
baseline are used.)<br />
Table 1 Examples of GL arranged by classification taken from the<br />
international tables (Foster-Powell et al., 2002)<br />
Food GI Serving<br />
size (g)<br />
Available<br />
carbohydrate (g)<br />
Watermelon 72 120 6 4<br />
Ice cream (high fat) 37 50 9 4<br />
Mashed potato 74 150 20 15<br />
Macaroni 47 180 48 23<br />
Parboiled rice 64 150 36 23<br />
Chocolate bar 65 60 40 26<br />
Porridge 58 250 22 13<br />
Corn flakes 81 30 26 21<br />
Abbreviations: GI, glycaemic index; GL, glycaemic load.<br />
GI available carbohydrate agrees well with GL measured<br />
directly, at least when food is consumed over a range of usual<br />
intakes (Venn et al., 2006). A GL classification system is used<br />
in which foods are categorized as having low (p10), medium<br />
(410–o20) or high GL (X20).<br />
The relationship between GI and GL is not straightforward;<br />
for example, a high GI food can have a low GL if eaten<br />
in small quantities. Conversely, a low GI food can have a<br />
high GL dependent upon the portion size eaten. This effect is<br />
demonstrated in Table 1, in which various foods from the<br />
International Tables have been selected (Foster-Powell et al.,<br />
2002). A ‘serving size’ of watermelon, a high GI food, has the<br />
same GL as a serving size of high fat ice cream, a low GI food.<br />
Mashed potato and macaroni may be contrasted with the<br />
lower GI food (macaroni) having a higher GL per serving.<br />
GL