Polymers in Confined Geometry.pdf
Polymers in Confined Geometry.pdf
Polymers in Confined Geometry.pdf

Create successful ePaper yourself
Turn your PDF publications into a flip-book with our unique Google optimized e-Paper software.
5.2. THE HARMONIC POTENTIAL 67<br />
R 2 /L 2<br />
1<br />
0.9<br />
0.8<br />
0.7<br />
0.6<br />
0.5<br />
0.4<br />
0.3<br />
0.2<br />
0.1<br />
analytic<br />
N = 50<br />
N = 100<br />
N = 500<br />
N = 1000<br />
1<br />
1<br />
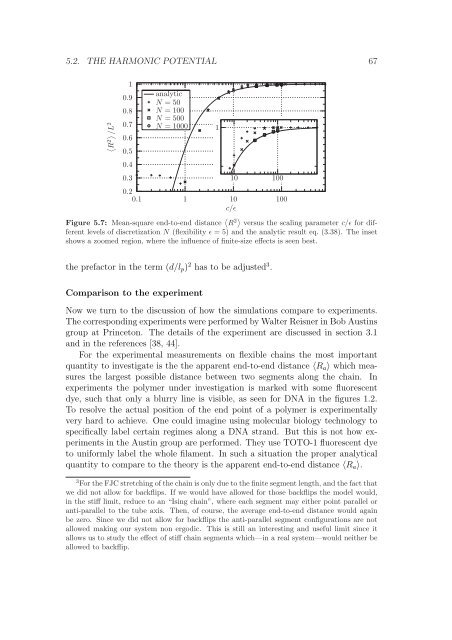
Figure 5.7: Mean-square end-to-end distance R 2 versus the scal<strong>in</strong>g parameter c/ɛ for different<br />
levels of discretization N (flexibility ɛ = 5) and the analytic result eq. (3.38). The <strong>in</strong>set<br />
shows a zoomed region, where the <strong>in</strong>fluence of f<strong>in</strong>ite-size effects is seen best.<br />
10<br />
10<br />
c/ɛ<br />
the prefactor <strong>in</strong> the term (d/lp) 2 has to be adjusted 3 .<br />
Comparison to the experiment<br />
Now we turn to the discussion of how the simulations compare to experiments.<br />
The correspond<strong>in</strong>g experiments were performed by Walter Reisner <strong>in</strong> Bob Aust<strong>in</strong>s<br />
group at Pr<strong>in</strong>ceton. The details of the experiment are discussed <strong>in</strong> section 3.1<br />
and <strong>in</strong> the references [38, 44].<br />
For the experimental measurements on flexible cha<strong>in</strong>s the most important<br />
quantity to <strong>in</strong>vestigate is the the apparent end-to-end distance 〈Ra〉 which measures<br />
the largest possible distance between two segments along the cha<strong>in</strong>. In<br />
experiments the polymer under <strong>in</strong>vestigation is marked with some fluorescent<br />
dye, such that only a blurry l<strong>in</strong>e is visible, as seen for DNA <strong>in</strong> the figures 1.2.<br />
To resolve the actual position of the end po<strong>in</strong>t of a polymer is experimentally<br />
very hard to achieve. One could imag<strong>in</strong>e us<strong>in</strong>g molecular biology technology to<br />
specifically label certa<strong>in</strong> regimes along a DNA strand. But this is not how experiments<br />
<strong>in</strong> the Aust<strong>in</strong> group are performed. They use TOTO-1 fluorescent dye<br />
to uniformly label the whole filament. In such a situation the proper analytical<br />
quantity to compare to the theory is the apparent end-to-end distance 〈Ra〉.<br />
3 For the FJC stretch<strong>in</strong>g of the cha<strong>in</strong> is only due to the f<strong>in</strong>ite segment length, and the fact that<br />
we did not allow for backflips. If we would have allowed for those backflips the model would,<br />
<strong>in</strong> the stiff limit, reduce to an “Is<strong>in</strong>g cha<strong>in</strong>”, where each segment may either po<strong>in</strong>t parallel or<br />
anti-parallel to the tube axis. Then, of course, the average end-to-end distance would aga<strong>in</strong><br />
be zero. S<strong>in</strong>ce we did not allow for backflips the anti-parallel segment configurations are not<br />
allowed mak<strong>in</strong>g our system non ergodic. This is still an <strong>in</strong>terest<strong>in</strong>g and useful limit s<strong>in</strong>ce it<br />
allows us to study the effect of stiff cha<strong>in</strong> segments which—<strong>in</strong> a real system—would neither be<br />
allowed to backflip.<br />
100<br />
100