

3 Issuing costs of state guaranteed bonds - Financial Risk and ...
3 Issuing costs of state guaranteed bonds - Financial Risk and ...
3 Issuing costs of state guaranteed bonds - Financial Risk and ...

Create successful ePaper yourself
Turn your PDF publications into a flip-book with our unique Google optimized e-Paper software.
4 Impact <strong>of</strong> <strong>state</strong> <strong>guaranteed</strong> <strong>bonds</strong> on bank lending, funding <strong>and</strong> pr<strong>of</strong>itability performance<br />
In regard to <strong>state</strong> guarantees, there is some consistency between this framework <strong>and</strong> the<br />
framework relating to the influence <strong>of</strong> capital regulation on capital structure. Namely, there may<br />
exist some element <strong>of</strong> 'moral hazard' ins<strong>of</strong>ar as banks may be motivated to hold smaller capital<br />
buffers in the knowledge that missed SG bond payments are covered by <strong>state</strong> guarantors.<br />
However, banks may also be aware that missing SG bond payments would signal that they are<br />
ailing, causing the cost <strong>of</strong> raising funds to increase, meaning that they may hold additional capital<br />
buffers to guard themselves against this possibility.<br />
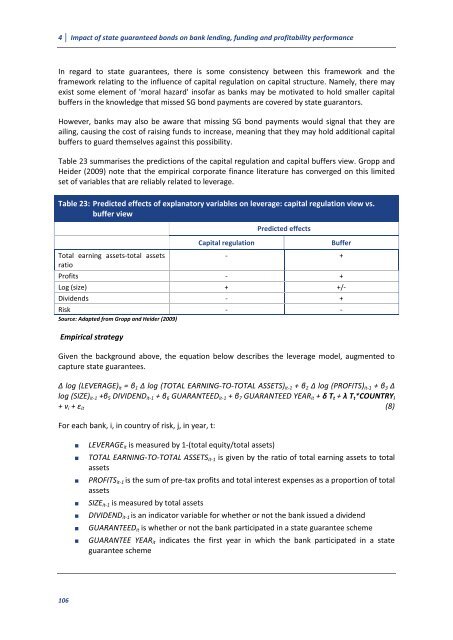
Table 23 summarises the predictions <strong>of</strong> the capital regulation <strong>and</strong> capital buffers view. Gropp <strong>and</strong><br />
Heider (2009) note that the empirical corporate finance literature has converged on this limited<br />
set <strong>of</strong> variables that are reliably related to leverage.<br />
Table 23: Predicted effects <strong>of</strong> explanatory variables on leverage: capital regulation view vs.<br />
buffer view<br />
Total earning assets-total assets<br />
ratio<br />
106<br />
Predicted effects<br />
Capital regulation Buffer<br />
- +<br />
Pr<strong>of</strong>its - +<br />
Log (size) + +/-<br />
Dividends - +<br />
<strong>Risk</strong> - -<br />
Source: Adapted from Gropp <strong>and</strong> Heider (2009)<br />
Empirical strategy<br />
Given the background above, the equation below describes the leverage model, augmented to<br />
capture <strong>state</strong> guarantees.<br />
log (LEVERAGE)it 1 log (TOTAL EARNING-TO-TOTAL ASSETS)it-1 2 log (PROFITS)it-1 3 <br />
log (SIZE)it-1 5 DIVIDENDit-1 6 GUARANTEEDit-1 7 GUARANTEED YEARit t t*i<br />
vi it<br />
(8)<br />
For each bank, i, in country <strong>of</strong> risk, j, in year, t:<br />
LEVERAGEit is measured by 1-(total equity/total assets)<br />
TOTAL EARNING-TO-TOTAL ASSETSit-1 is given by the ratio <strong>of</strong> total earning assets to total<br />
assets<br />
PROFITSit-1 is the sum <strong>of</strong> pre-tax pr<strong>of</strong>its <strong>and</strong> total interest expenses as a proportion <strong>of</strong> total<br />
assets<br />
SIZEit-1 is measured by total assets<br />
DIVIDENDit-1 is an indicator variable for whether or not the bank issued a dividend<br />
GUARANTEEDit is whether or not the bank participated in a <strong>state</strong> guarantee scheme<br />
GUARANTEE YEARit indicates the first year in which the bank participated in a <strong>state</strong><br />
guarantee scheme


