

3 Issuing costs of state guaranteed bonds - Financial Risk and ...
3 Issuing costs of state guaranteed bonds - Financial Risk and ...
3 Issuing costs of state guaranteed bonds - Financial Risk and ...

Create successful ePaper yourself
Turn your PDF publications into a flip-book with our unique Google optimized e-Paper software.
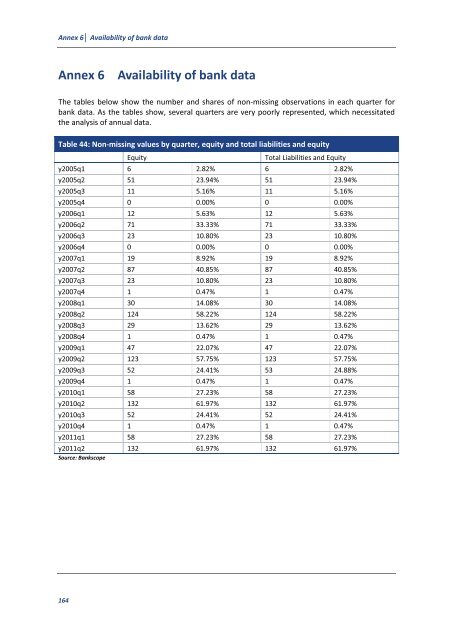
Annex 6 Availability <strong>of</strong> bank data<br />
Annex 6 Availability <strong>of</strong> bank data<br />
The tables below show the number <strong>and</strong> shares <strong>of</strong> non-missing observations in each quarter for<br />
bank data. As the tables show, several quarters are very poorly represented, which necessitated<br />
the analysis <strong>of</strong> annual data.<br />
Table 44: Non-missing values by quarter, equity <strong>and</strong> total liabilities <strong>and</strong> equity<br />
Equity Total Liabilities <strong>and</strong> Equity<br />
y2005q1 6 2.82% 6 2.82%<br />
y2005q2 51 23.94% 51 23.94%<br />
y2005q3 11 5.16% 11 5.16%<br />
y2005q4 0 0.00% 0 0.00%<br />
y2006q1 12 5.63% 12 5.63%<br />
y2006q2 71 33.33% 71 33.33%<br />
y2006q3 23 10.80% 23 10.80%<br />
y2006q4 0 0.00% 0 0.00%<br />
y2007q1 19 8.92% 19 8.92%<br />
y2007q2 87 40.85% 87 40.85%<br />
y2007q3 23 10.80% 23 10.80%<br />
y2007q4 1 0.47% 1 0.47%<br />
y2008q1 30 14.08% 30 14.08%<br />
y2008q2 124 58.22% 124 58.22%<br />
y2008q3 29 13.62% 29 13.62%<br />
y2008q4 1 0.47% 1 0.47%<br />
y2009q1 47 22.07% 47 22.07%<br />
y2009q2 123 57.75% 123 57.75%<br />
y2009q3 52 24.41% 53 24.88%<br />
y2009q4 1 0.47% 1 0.47%<br />
y2010q1 58 27.23% 58 27.23%<br />
y2010q2 132 61.97% 132 61.97%<br />
y2010q3 52 24.41% 52 24.41%<br />
y2010q4 1 0.47% 1 0.47%<br />
y2011q1 58 27.23% 58 27.23%<br />
y2011q2<br />
Source: Bankscope<br />
132 61.97% 132 61.97%<br />
164


