

3 Issuing costs of state guaranteed bonds - Financial Risk and ...
3 Issuing costs of state guaranteed bonds - Financial Risk and ...
3 Issuing costs of state guaranteed bonds - Financial Risk and ...

You also want an ePaper? Increase the reach of your titles
YUMPU automatically turns print PDFs into web optimized ePapers that Google loves.
2 Overview <strong>of</strong> <strong>state</strong> guarantee schemes<br />
State in the absence <strong>of</strong> intervention. Additionally, the policy approach foresaw regular monitoring<br />
<strong>of</strong> economic conditions as any interventions should be temporary by nature <strong>and</strong> relate only to the<br />
duration <strong>of</strong> the crisis situation.<br />
The sections below provide a more detailed overview <strong>of</strong> trends in the use <strong>of</strong> <strong>state</strong> guarantees.<br />
2.2 Patterns <strong>of</strong> issuance activity<br />
2.2.1 Issuance activity over time<br />
Between October 2008 <strong>and</strong> December 2010 close to 1,000 SG bond issues worth over €500bn<br />
were brought to market by banks with EU Member States acting as guarantors.<br />
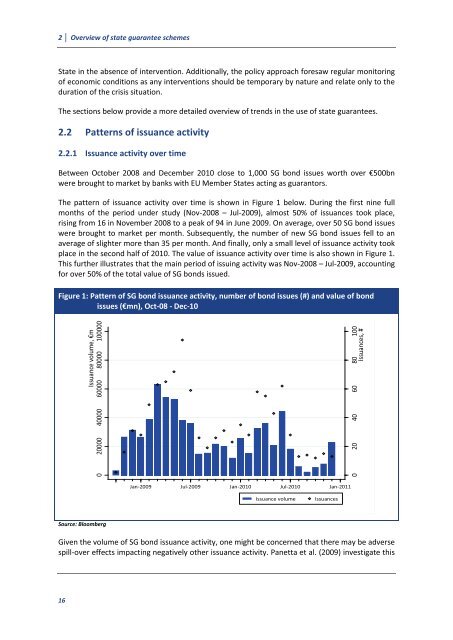
The pattern <strong>of</strong> issuance activity over time is shown in Figure 1 below. During the first nine full<br />
months <strong>of</strong> the period under study (Nov-2008 – Jul-2009), almost 50% <strong>of</strong> issuances took place,<br />
rising from 16 in November 2008 to a peak <strong>of</strong> 94 in June 2009. On average, over 50 SG bond issues<br />
were brought to market per month. Subsequently, the number <strong>of</strong> new SG bond issues fell to an<br />
average <strong>of</strong> slighter more than 35 per month. And finally, only a small level <strong>of</strong> issuance activity took<br />
place in the second half <strong>of</strong> 2010. The value <strong>of</strong> issuance activity over time is also shown in Figure 1.<br />
This further illustrates that the main period <strong>of</strong> issuing activity was Nov-2008 – Jul-2009, accounting<br />
for over 50% <strong>of</strong> the total value <strong>of</strong> SG <strong>bonds</strong> issued.<br />
Figure 1: Pattern <strong>of</strong> SG bond issuance activity, number <strong>of</strong> bond issues (#) <strong>and</strong> value <strong>of</strong> bond<br />
issues (€mn), Oct-08 - Dec-10<br />
16<br />
Issuance volume, €m<br />
0 20000 40000 60000 80000 100000<br />
Source: Bloomberg<br />
Jan-2009 Jul-2009 Jan-2010 Jul-2010 Jan-2011<br />
Issuance volume Issuances<br />
Given the volume <strong>of</strong> SG bond issuance activity, one might be concerned that there may be adverse<br />
spill-over effects impacting negatively other issuance activity. Panetta et al. (2009) investigate this<br />
0 20 40 60 80 100<br />
Issuances, #


