3 Issuing costs of state guaranteed bonds - Financial Risk and ...
3 Issuing costs of state guaranteed bonds - Financial Risk and ...
3 Issuing costs of state guaranteed bonds - Financial Risk and ...
You also want an ePaper? Increase the reach of your titles
YUMPU automatically turns print PDFs into web optimized ePapers that Google loves.
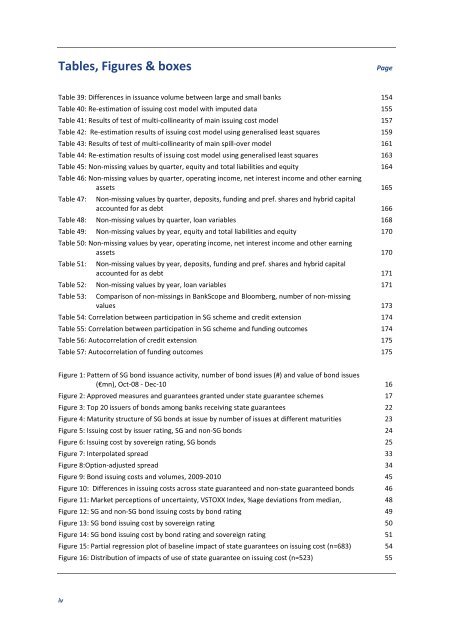
Tables, Figures & boxes Page<br />
Table 39: Differences in issuance volume between large <strong>and</strong> small banks 154<br />
Table 40: Re-estimation <strong>of</strong> issuing cost model with imputed data 155<br />
Table 41: Results <strong>of</strong> test <strong>of</strong> multi-collinearity <strong>of</strong> main issuing cost model 157<br />
Table 42: Re-estimation results <strong>of</strong> issuing cost model using generalised least squares 159<br />
Table 43: Results <strong>of</strong> test <strong>of</strong> multi-collinearity <strong>of</strong> main spill-over model 161<br />
Table 44: Re-estimation results <strong>of</strong> issuing cost model using generalised least squares 163<br />
Table 45: Non-missing values by quarter, equity <strong>and</strong> total liabilities <strong>and</strong> equity 164<br />
Table 46: Non-missing values by quarter, operating income, net interest income <strong>and</strong> other earning<br />
assets 165<br />
Table 47: Non-missing values by quarter, deposits, funding <strong>and</strong> pref. shares <strong>and</strong> hybrid capital<br />
accounted for as debt 166<br />
Table 48: Non-missing values by quarter, loan variables 168<br />
Table 49: Non-missing values by year, equity <strong>and</strong> total liabilities <strong>and</strong> equity 170<br />
Table 50: Non-missing values by year, operating income, net interest income <strong>and</strong> other earning<br />
assets 170<br />
Table 51: Non-missing values by year, deposits, funding <strong>and</strong> pref. shares <strong>and</strong> hybrid capital<br />
accounted for as debt 171<br />
Table 52: Non-missing values by year, loan variables 171<br />
Table 53: Comparison <strong>of</strong> non-missings in BankScope <strong>and</strong> Bloomberg, number <strong>of</strong> non-missing<br />
values 173<br />
Table 54: Correlation between participation in SG scheme <strong>and</strong> credit extension 174<br />
Table 55: Correlation between participation in SG scheme <strong>and</strong> funding outcomes 174<br />
Table 56: Autocorrelation <strong>of</strong> credit extension 175<br />
Table 57: Autocorrelation <strong>of</strong> funding outcomes 175<br />
Figure 1: Pattern <strong>of</strong> SG bond issuance activity, number <strong>of</strong> bond issues (#) <strong>and</strong> value <strong>of</strong> bond issues<br />
(€mn), Oct-08 - Dec-10 16<br />
Figure 2: Approved measures <strong>and</strong> guarantees granted under <strong>state</strong> guarantee schemes 17<br />
Figure 3: Top 20 issuers <strong>of</strong> <strong>bonds</strong> among banks receiving <strong>state</strong> guarantees 22<br />
Figure 4: Maturity structure <strong>of</strong> SG <strong>bonds</strong> at issue by number <strong>of</strong> issues at different maturities 23<br />
Figure 5: <strong>Issuing</strong> cost by issuer rating, SG <strong>and</strong> non-SG <strong>bonds</strong> 24<br />
Figure 6: <strong>Issuing</strong> cost by sovereign rating, SG <strong>bonds</strong> 25<br />
Figure 7: Interpolated spread 33<br />
Figure 8:Option-adjusted spread 34<br />
Figure 9: Bond issuing <strong>costs</strong> <strong>and</strong> volumes, 2009-2010 45<br />
Figure 10: Differences in issuing <strong>costs</strong> across <strong>state</strong> <strong>guaranteed</strong> <strong>and</strong> non-<strong>state</strong> <strong>guaranteed</strong> <strong>bonds</strong> 46<br />
Figure 11: Market perceptions <strong>of</strong> uncertainty, VSTOXX Index, %age deviations from median, 48<br />
Figure 12: SG <strong>and</strong> non-SG bond issuing <strong>costs</strong> by bond rating 49<br />
Figure 13: SG bond issuing cost by sovereign rating 50<br />
Figure 14: SG bond issuing cost by bond rating <strong>and</strong> sovereign rating 51<br />
Figure 15: Partial regression plot <strong>of</strong> baseline impact <strong>of</strong> <strong>state</strong> guarantees on issuing cost (n=683) 54<br />
Figure 16: Distribution <strong>of</strong> impacts <strong>of</strong> use <strong>of</strong> <strong>state</strong> guarantee on issuing cost (n=523) 55<br />
iv


