- Page 1 and 2:
GAMMON INDIA LIMITED (Incorporated
- Page 3 and 4:
NOTICE TO INVESTORS The Company acc
- Page 5 and 6:
usiness strategies and environment
- Page 7 and 8:
epresentation, warranty or statemen
- Page 9 and 10:
SEBI nor any other regulatory autho
- Page 11 and 12:
FORWARD LOOKING STATEMENTS All stat
- Page 13 and 14:
Term Description Company in consult
- Page 15 and 16:
Term Description NH National Highwa
- Page 17 and 18:
Lock-up The Company will not, for a
- Page 19 and 20:
ased in Italy that is engaged in th
- Page 21 and 22:
for our short-term commercial paper
- Page 23 and 24:
Sr. No. SUMMARY FINANCIAL INFORMATI
- Page 25 and 26:
REFORMATTED CONSOLIDATED BALANCE SH
- Page 27 and 28:
REFORMATTED CONSOLIDATED PROFIT AND
- Page 29 and 30:
REFORMATTED CONSOLIDATED CASH FLOW
- Page 31 and 32:
RISK FACTORS An investment in equit
- Page 33 and 34:
affect on the profit margins that w
- Page 35 and 36:
As the revenue structure for the SP
- Page 37 and 38:
of actual traffic volume. Adverse d
- Page 39 and 40:
esult in decreased sales of our pro
- Page 41 and 42:
in two or three years) of interest
- Page 43 and 44:
If our subsidiaries or SPVs default
- Page 45 and 46:
Our inability to obtain, renew or m
- Page 47 and 48:
As of March 31, 2009, our contingen
- Page 49 and 50:
on which such additional financing
- Page 51 and 52:
The Equity Shares are being offered
- Page 53 and 54:
market for our equity shares will n
- Page 55 and 56:
(of sale proceeds), a no objection/
- Page 57 and 58:
Date National Stock Exchange of Ind
- Page 59 and 60:
USE OF PROCEEDS The total proceeds
- Page 61 and 62:
Vesting Date No. Of Options Exercis
- Page 63 and 64:
EXCHANGE RATE INFORMATION The follo
- Page 65 and 66:
development phase. GIPL also offers
- Page 67 and 68:
during summer months and during the
- Page 69 and 70:
c) Revenues from providing services
- Page 71 and 72:
Intangible assets are amortized ove
- Page 73 and 74:
Guidelines, 1999 issued by Securiti
- Page 75 and 76:
and tax credit, if any, and compute
- Page 77 and 78:
Profit After Tax. Our profit after
- Page 79 and 80:
primarily by trade payables and wor
- Page 81 and 82:
and components are fluctuating base
- Page 83 and 84:
Development Authorities, Metro Rail
- Page 85 and 86:
Indian Road Network Kilometers (app
- Page 87 and 88:
plan will soon be presented to the
- Page 89 and 90:
The Airports Sector in India Indian
- Page 91 and 92:
An investment of about Rs.720,600.0
- Page 93 and 94:
China’s electricity consumption h
- Page 95 and 96:
Source Central State Private Total
- Page 97 and 98:
Overview BUSINESS We are the flagsh
- Page 99 and 100:
** formerly Bedi Seaport Limited GA
- Page 101 and 102:
flue chimneys, nuclear containment
- Page 103 and 104:
For certain large construction or i
- Page 105 and 106:
oriented services. In addition, we
- Page 107 and 108:
Kalwakruthy Stage-3-Lift Irrigation
- Page 109 and 110:
Name of SPV Revenue Model MNEL KBIC
- Page 111 and 112:
Ansaldo Oseberg D Offshore Platfor
- Page 113 and 114:
ACCAM S.p.A. Incinerator Plant: Eur
- Page 115 and 116:
Our Company, with its joint venture
- Page 117 and 118:
Board of Directors BOARD OF DIRECTO
- Page 119 and 120:
Name, Designation, DIN and Address
- Page 121 and 122:
Name, Designation, DIN and Address
- Page 123 and 124:
Mr. Parvez Umrigar, is a B. Com., A
- Page 125 and 126:
Mr. Himanshu Parikh Pursuant to a s
- Page 127 and 128:
Organisation Chart 98
- Page 129 and 130:
Name Number of Equity Shareholding
- Page 131 and 132:
Shareholding Pattern PRINCIPAL SHAR
- Page 133 and 134:
Sl. No. Name of the Shareholder Lim
- Page 135 and 136:
Equity Shares allotted to a QIB pur
- Page 137 and 138:
FIIs are permitted to participate t
- Page 139 and 140:
The submission of an Application Fo
- Page 141 and 142:
ank). The QIB will be required to d
- Page 143 and 144:
Placement Agreement PLACEMENT The J
- Page 145 and 146:
SELLING RESTRICTIONS The distributi
- Page 147 and 148:
the shares, debentures and units of
- Page 149 and 150:
TRANSFER RESTRICTIONS Purchasers of
- Page 151 and 152:
The exceptions to this rule are for
- Page 153 and 154:
equirement to publish un-audited fi
- Page 155 and 156:
shares are listed). Further, any pe
- Page 157 and 158:
agreement, within the time period m
- Page 159 and 160:
for compulsory dematerialised tradi
- Page 161 and 162:
. by crediting shares of the Compan
- Page 163 and 164:
(including a corporation or company
- Page 165 and 166:
TAXATION The information provided b
- Page 167 and 168:
to be income chargeable under the h
- Page 169 and 170:
8. As per Section 74 Short-term cap
- Page 171 and 172:
long-term capital gains. Balance lo
- Page 173 and 174:
LEGAL PROCEEDINGS Save as described
- Page 175 and 176:
lack list GIL and also its allied/s
- Page 177 and 178:
Index to financial statements: FINA
- Page 179 and 180:
Sr. No. UNAUDITED FINANCIAL RESULTS
- Page 181 and 182:
from the foreign currency receivabl
- Page 183 and 184:
5. The financial statements of cert
- Page 185 and 186:
REFORMATTED CONSOLIDATED BALANCE SH
- Page 187 and 188:
GAMMON INDIA LIMITED REFORMATTED CO
- Page 189 and 190:
GAMMON INDIA LIMITED REFORMATTED CO
- Page 191 and 192: GAMMON INDIA LIMITED SCHEDULES FORM
- Page 193 and 194: GAMMON INDIA LIMITED SCHEDULES FORM
- Page 195 and 196: GAMMON INDIA LIMITED SCHEDULES FORM
- Page 197 and 198: 31.03.09 31.03.08 31.03.07 Rs.inMil
- Page 199 and 200: GAMMON INDIA LIMITED SCHEDULES FORM
- Page 201 and 202: SCHEDULE 15A SUNDRY EXPENSES INCLUD
- Page 203 and 204: SCHEDULE 18 SIGNIFICANT ACCOUNTING
- Page 205 and 206: 5. Research and Development Expense
- Page 207 and 208: (c) Work in progress from manufactu
- Page 209 and 210: Basic Earning Per Share is calculat
- Page 211 and 212: For the Year 2008- 09 For the Year
- Page 213 and 214: interest and voting rights in respe
- Page 215 and 216: y Busi Group. By an Agreement dated
- Page 217 and 218: Maritime Services Pvt. Ltd* Modern
- Page 219 and 220: the difference between outstanding
- Page 221 and 222: PVAN: Term Loans from ICICI Bank ar
- Page 223 and 224: foreign exchange loss of Rs. 11.20
- Page 225 and 226: In respect of some road projects co
- Page 227 and 228: Net Actuarial (gain)/loss To Be Rec
- Page 229 and 230: Further, during the year 2008-09, t
- Page 231 and 232: 30 Gammon Sadelmi (Power Plant in S
- Page 233 and 234: (c) Transactions of Oman Branch and
- Page 235 and 236: 11 Gammon Rizzani Gammon Rizzani Ga
- Page 237 and 238: Nature of Transactions / relationsh
- Page 239 and 240: Nature of Transactions / relationsh
- Page 241: Nature of Transactions / relationsh
- Page 245 and 246: Statement of recognised income and
- Page 247 and 248: 5. We have estimated and checked th
- Page 249 and 250: 4. As fully described by directors
- Page 251 and 252: Franco Tosi Meccanica S.p.A. INTROD
- Page 253 and 254: Franco Tosi Meccanica S.p.A. 2. INC
- Page 255 and 256: Franco Tosi Meccanica S.p.A. 4. FOR
- Page 257 and 258: Franco Tosi Meccanica S.p.A. The bo
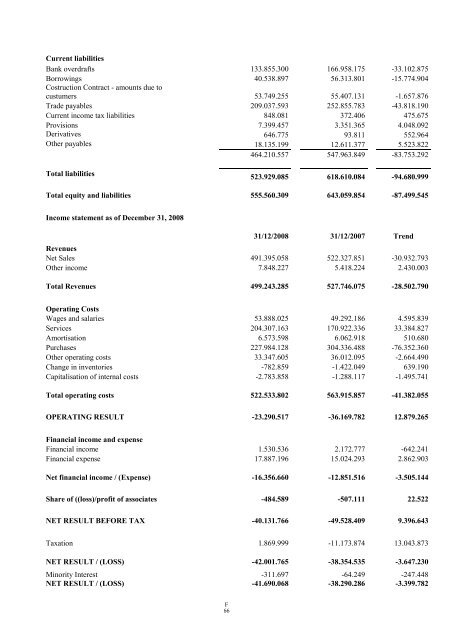
- Page 259 and 260: Franco Tosi Meccanica S.p.A. Revenu
- Page 261 and 262: Franco Tosi Meccanica S.p.A. Servic
- Page 263 and 264: Franco Tosi Meccanica S.p.A. 31.12.
- Page 265 and 266: Franco Tosi Meccanica S.p.A. Note 5
- Page 267 and 268: Franco Tosi Meccanica S.p.A. Note 9
- Page 269 and 270: Franco Tosi Meccanica S.p.A. Nota 1
- Page 271 and 272: Franco Tosi Meccanica S.p.A. Note 1
- Page 273 and 274: Franco Tosi Meccanica S.p.A. As pre
- Page 275 and 276: Franco Tosi Meccanica S.p.A. Deprec
- Page 277 and 278: To the Shareholders of Sae Power Li
- Page 279 and 280: SAE POWER LINES S.R.L. Società uni
- Page 281 and 282: SAE POWER LINES S.R.L. IV. Liquid a
- Page 283 and 284: SAE POWER LINES S.R.L. Profit and l
- Page 285 and 286: SAE POWER LINES S.R.L. Company with
- Page 287 and 288: underlying formal aspects. Fixed as
- Page 289 and 290: Italian Exchange Rates Office (U.I.
- Page 291 and 292: Description Value Monetary revaluat
- Page 293 and 294:
Accounts receivable by geographical
- Page 295 and 296:
This item can be broken down as fol
- Page 297 and 298:
Description 31/12/2007 Additions De
- Page 299 and 300:
Accounts payable by geographical ar
- Page 301 and 302:
Description 31/12/2008 31/12/2007 C
- Page 303 and 304:
Taxes Value at 31/12/2008 Value at
- Page 305 and 306:
the reasonable certainty that in fu
- Page 307:
ISSUER Gammon India Limited REGISTE