GAMMON INDIA LIMITED
GAMMON INDIA LIMITED
GAMMON INDIA LIMITED

You also want an ePaper? Increase the reach of your titles
YUMPU automatically turns print PDFs into web optimized ePapers that Google loves.
primarily by trade payables and working capital finances of Rs.1,897.54 million, and loan and advances of<br />
Rs.785.63 million and decreased primarily by trade and other receivables of Rs.1,859.86 million, tax<br />
expenses paid of Rs.1,282.76 million and inventories of Rs.528.35 million.<br />
Our net cash used in operating activities for the year ended March 31, 2007 was Rs.1,303.62 million,<br />
consisting of operating profit before working capital changes of Rs.2,888.87 million, increased primarily by<br />
trade payables and working capital finances of Rs.710.80 million and decreased primarily by loan and<br />
advances of Rs.1,690.00 million, inventories of Rs.1,561.70 million, trade and other receivables of<br />
Rs.1,252.00 million and tax expenses paid of Rs.388.80 million.<br />
Investment Activities<br />
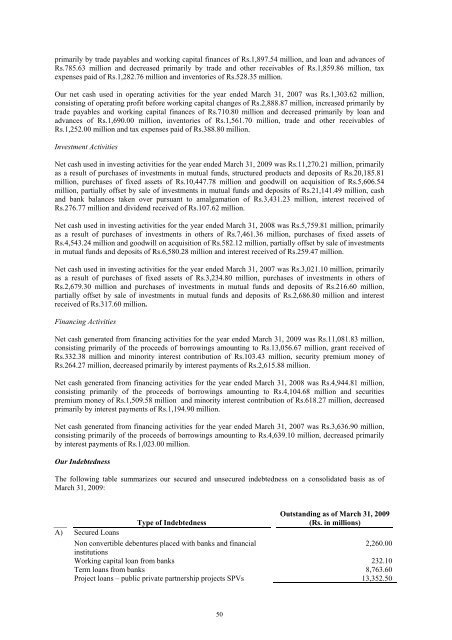
Net cash used in investing activities for the year ended March 31, 2009 was Rs.11,270.21 million, primarily<br />
as a result of purchases of investments in mutual funds, structured products and deposits of Rs.20,185.81<br />
million, purchases of fixed assets of Rs.10,447.78 million and goodwill on acquisition of Rs.5,606.54<br />
million, partially offset by sale of investments in mutual funds and deposits of Rs.21,141.49 million, cash<br />
and bank balances taken over pursuant to amalgamation of Rs.3,431.23 million, interest received of<br />
Rs.276.77 million and dividend received of Rs.107.62 million.<br />
Net cash used in investing activities for the year ended March 31, 2008 was Rs.5,759.81 million, primarily<br />
as a result of purchases of investments in others of Rs.7,461.36 million, purchases of fixed assets of<br />
Rs.4,543.24 million and goodwill on acquisition of Rs.582.12 million, partially offset by sale of investments<br />
in mutual funds and deposits of Rs.6,580.28 million and interest received of Rs.259.47 million.<br />
Net cash used in investing activities for the year ended March 31, 2007 was Rs.3,021.10 million, primarily<br />
as a result of purchases of fixed assets of Rs.3,234.80 million, purchases of investments in others of<br />
Rs.2,679.30 million and purchases of investments in mutual funds and deposits of Rs.216.60 million,<br />
partially offset by sale of investments in mutual funds and deposits of Rs.2,686.80 million and interest<br />
received of Rs.317.60 million.<br />
Financing Activities<br />
Net cash generated from financing activities for the year ended March 31, 2009 was Rs.11,081.83 million,<br />
consisting primarily of the proceeds of borrowings amounting to Rs.13,056.67 million, grant received of<br />
Rs.332.38 million and minority interest contribution of Rs.103.43 million, security premium money of<br />
Rs.264.27 million, decreased primarily by interest payments of Rs.2,615.88 million.<br />
Net cash generated from financing activities for the year ended March 31, 2008 was Rs.4,944.81 million,<br />
consisting primarily of the proceeds of borrowings amounting to Rs.4,104.68 million and securities<br />
premium money of Rs.1,509.58 million and minority interest contribution of Rs.618.27 million, decreased<br />
primarily by interest payments of Rs.1,194.90 million.<br />
Net cash generated from financing activities for the year ended March 31, 2007 was Rs.3,636.90 million,<br />
consisting primarily of the proceeds of borrowings amounting to Rs.4,639.10 million, decreased primarily<br />
by interest payments of Rs.1,023.00 million.<br />
Our Indebtedness<br />
The following table summarizes our secured and unsecured indebtedness on a consolidated basis as of<br />
March 31, 2009:<br />
Type of Indebtedness<br />
Outstanding as of March 31, 2009<br />
(Rs. in millions)<br />
A) Secured Loans<br />
Non convertible debentures placed with banks and financial<br />
institutions<br />
2,260.00<br />
Working capital loan from banks 232.10<br />
Term loans from banks 8,763.60<br />
Project loans – public private partnership projects SPVs 13,352.50<br />
50