GAMMON INDIA LIMITED
GAMMON INDIA LIMITED
GAMMON INDIA LIMITED

You also want an ePaper? Increase the reach of your titles
YUMPU automatically turns print PDFs into web optimized ePapers that Google loves.
and tax credit, if any, and computed in accordance with the provisions of applicable law. Deferred tax arises<br />
mainly due to the timing differences between accounting income and the estimated taxable income for the<br />
period and is quantified using the tax rates and laws enacted or substantially enacted as on the relevant<br />
balance sheet date. Our deferred tax liability is recognized net of deferred tax assets, if any.<br />
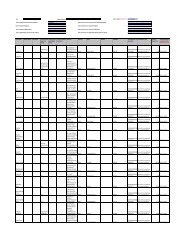
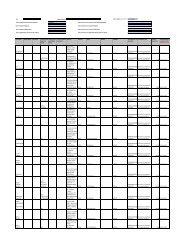
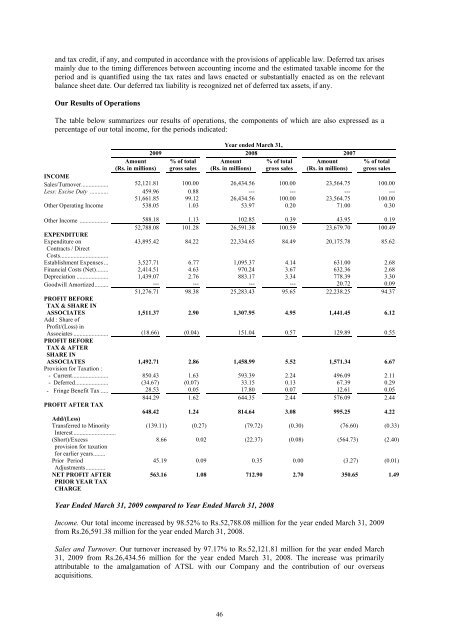
Our Results of Operations<br />
The table below summarizes our results of operations, the components of which are also expressed as a<br />
percentage of our total income, for the periods indicated:<br />
2009<br />
Year ended March 31,<br />
2008 2007<br />
Amount % of total Amount % of total Amount % of total<br />
(Rs. in millions) gross sales (Rs. in millions) gross sales (Rs. in millions) gross sales<br />
INCOME<br />
Sales/Turnover.................. 52,121.81 100.00 26,434.56 100.00 23,564.75 100.00<br />
Less: Excise Duty ............ 459.96 0.88 --- --- --- ---<br />
51,661.85 99.12 26,434.56 100.00 23,564.75 100.00<br />
Other Operating Income<br />
538.05 1.03 53.97 0.20 71.00 0.30<br />
Other Income ................... 588.18 1.13 102.85 0.39 43.95 0.19<br />
EXPENDITURE<br />
52,788.08 101.28 26,591.38 100.59 23,679.70 100.49<br />
Expenditure on<br />
Contracts / Direct<br />
43,895.42 84.22 22,334.65 84.49 20,175.78 85.62<br />
Costs................................<br />
Establishment Expenses ... 3,527.71 6.77 1,095.37 4.14 631.00 2.68<br />
Financial Costs (Net)........ 2,414.51 4.63 970.24 3.67 632.36 2.68<br />
Depreciation ..................... 1,439.07 2.76 883.17 3.34 778.39 3.30<br />
Goodwill Amortized......... --- --- --- --- 20.72 0.09<br />
PROFIT BEFORE<br />
TAX & SHARE IN<br />
51,276.71 98.38 25,283.43 95.65 22,238.25 94.37<br />
ASSOCIATES<br />
Add : Share of<br />
1,511.37 2.90 1,307.95 4.95 1,441.45 6.12<br />
Profit/(Loss) in<br />
Associates .......................<br />
PROFIT BEFORE<br />
TAX & AFTER<br />
SHARE IN<br />
(18.66) (0.04) 151.04 0.57 129.89 0.55<br />
ASSOCIATES<br />
Provision for Taxation :<br />
1,492.71 2.86 1,458.99 5.52 1,571.34 6.67<br />
- Current........................ 850.43 1.63 593.39 2.24 496.09 2.11<br />
- Deferred...................... (34.67) (0.07) 33.15 0.13 67.39 0.29<br />
- Fringe Benefit Tax ..... 28.53 0.05 17.80 0.07 12.61 0.05<br />
PROFIT AFTER TAX<br />
844.29 1.62 644.35 2.44 576.09 2.44<br />
Add/(Less)<br />
648.42 1.24 814.64 3.08 995.25 4.22<br />
Transferred to Minority<br />
(139.11) (0.27) (79.72) (0.30) (76.60) (0.33)<br />
Interest ............................<br />
(Short)/Excess<br />
provision for taxation<br />
for earlier years........<br />
Prior Period<br />
Adjustments.............<br />
NET PROFIT AFTER<br />
PRIOR YEAR TAX<br />
CHARGE<br />
8.66 0.02 (22.37) (0.08) (564.73) (2.40)<br />
45.19 0.09 0.35 0.00 (3.27) (0.01)<br />
563.16 1.08 712.90 2.70 350.65 1.49<br />
Year Ended March 31, 2009 compared to Year Ended March 31, 2008<br />
Income. Our total income increased by 98.52% to Rs.52,788.08 million for the year ended March 31, 2009<br />
from Rs.26,591.38 million for the year ended March 31, 2008.<br />
Sales and Turnover. Our turnover increased by 97.17% to Rs.52,121.81 million for the year ended March<br />
31, 2009 from Rs.26,434.56 million for the year ended March 31, 2008. The increase was primarily<br />
attributable to the amalgamation of ATSL with our Company and the contribution of our overseas<br />
acquisitions.<br />
46