- Page 1:
WALL ROUGHNESS EFFECTS ON FLOW AND
- Page 4 and 5:
Abstract By applying vertical ribs
- Page 6 and 7:
Résumé En disposant des nervures
- Page 8 and 9:
Zusammenfassung • Ein markanter S
- Page 10 and 11:
Acknowledgments page x / November 9
- Page 12 and 13:
Table of contents 4. Smart & Jäggi
- Page 14 and 15:
Table of contents 7.6 Summary and c
- Page 16 and 17:
Chapter 1 - Introduction 1.1 Contex
- Page 18 and 19:
Chapter 1 - Introduction page 4 / N
- Page 20 and 21:
Chapter 2 - State of the art 2.1 Fl
- Page 22 and 23:
Chapter 2 - State of the art 2.2.2
- Page 24 and 25:
Chapter 2 - State of the art Theref
- Page 26 and 27:
Chapter 2 - State of the art resolu
- Page 28 and 29:
Chapter 2 - State of the art comple
- Page 30 and 31:
Chapter 2 - State of the art ORLAND
- Page 32 and 33:
Chapter 2 - State of the art 2.6 Me
- Page 34 and 35:
Chapter 2 - State of the art page 2
- Page 36 and 37:
Chapter 3 - Theoretical considerati
- Page 38 and 39:
Chapter 3 - Theoretical considerati
- Page 40 and 41:
Chapter 3 - Theoretical considerati
- Page 42 and 43:
Chapter 3 - Theoretical considerati
- Page 44 and 45:
Chapter 3 - Theoretical considerati
- Page 46 and 47:
Chapter 3 - Theoretical considerati
- Page 48 and 49: Chapter 3 - Theoretical considerati
- Page 50 and 51: Chapter 3 - Theoretical considerati
- Page 52 and 53: Chapter 3 - Theoretical considerati
- Page 54 and 55: Chapter 3 - Theoretical considerati
- Page 56 and 57: Chapter 3 - Theoretical considerati
- Page 58 and 59: Chapter 3 - Theoretical considerati
- Page 60 and 61: Chapter 3 - Theoretical considerati
- Page 62 and 63: Chapter 3 - Theoretical considerati
- Page 64 and 65: Chapter 3 - Theoretical considerati
- Page 66 and 67: Chapter 3 - Theoretical considerati
- Page 68 and 69: Chapter 3 - Theoretical considerati
- Page 70 and 71: Chapter 3 - Theoretical considerati
- Page 72 and 73: Chapter 3 - Theoretical considerati
- Page 74 and 75: Chapter 3 - Theoretical considerati
- Page 76 and 77: Chapter 3 - Theoretical considerati
- Page 78 and 79: Chapter 3 - Theoretical considerati
- Page 80 and 81: Chapter 3 - Theoretical considerati
- Page 82 and 83: Chapter 4 - Experimental setup and
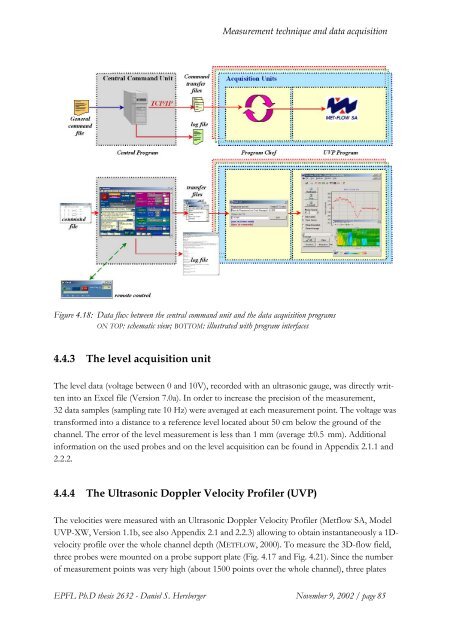
- Page 84 and 85: Chapter 4 - Experimental setup and
- Page 86 and 87: Chapter 4 - Experimental setup and
- Page 88 and 89: Chapter 4 - Experimental setup and
- Page 90 and 91: Chapter 4 - Experimental setup and
- Page 92 and 93: Chapter 4 - Experimental setup and
- Page 94 and 95: Chapter 4 - Experimental setup and
- Page 96 and 97: Chapter 4 - Experimental setup and
- Page 100 and 101: Chapter 4 - Experimental setup and
- Page 102 and 103: Chapter 4 - Experimental setup and
- Page 104 and 105: Chapter 4 - Experimental setup and
- Page 106 and 107: Chapter 4 - Experimental setup and
- Page 108 and 109: Chapter 4 - Experimental setup and
- Page 110 and 111: Chapter 4 - Experimental setup and
- Page 112 and 113: Chapter 4 - Experimental setup and
- Page 114 and 115: Chapter 5 - Test results 5.1 Introd
- Page 116 and 117: Chapter 5 - Test results 5.2 Prelim
- Page 118 and 119: Chapter 5 - Test results with and w
- Page 120 and 121: Chapter 5 - Test results 5.2.2 Test
- Page 122 and 123: Chapter 5 - Test results 5.3 Main t
- Page 124 and 125: Chapter 5 - Test results and 210 l/
- Page 126 and 127: Chapter 5 - Test results 5.5 Tests
- Page 128 and 129: Chapter 6 - Analysis of the test re
- Page 130 and 131: Chapter 6 - Analysis of the test re
- Page 132 and 133: Chapter 6 - Analysis of the test re
- Page 134 and 135: Chapter 6 - Analysis of the test re
- Page 136 and 137: Chapter 6 - Analysis of the test re
- Page 138 and 139: Chapter 6 - Analysis of the test re
- Page 140 and 141: Chapter 6 - Analysis of the test re
- Page 142 and 143: Chapter 6 - Analysis of the test re
- Page 144 and 145: Chapter 6 - Analysis of the test re
- Page 146 and 147: Chapter 6 - Analysis of the test re
- Page 148 and 149:
Chapter 6 - Analysis of the test re
- Page 150 and 151:
Chapter 6 - Analysis of the test re
- Page 152 and 153:
Chapter 6 - Analysis of the test re
- Page 154 and 155:
Chapter 6 - Analysis of the test re
- Page 156 and 157:
Chapter 6 - Analysis of the test re
- Page 158 and 159:
Chapter 6 - Analysis of the test re
- Page 160 and 161:
Chapter 6 - Analysis of the test re
- Page 162 and 163:
Chapter 6 - Analysis of the test re
- Page 164 and 165:
Chapter 7 - Establishing an empiric
- Page 166 and 167:
Chapter 7 - Establishing an empiric
- Page 168 and 169:
Chapter 7 - Establishing an empiric
- Page 170 and 171:
Chapter 7 - Establishing an empiric
- Page 172 and 173:
Chapter 7 - Establishing an empiric
- Page 174 and 175:
Chapter 7 - Establishing an empiric
- Page 176 and 177:
Chapter 7 - Establishing an empiric
- Page 178 and 179:
Chapter 7 - Establishing an empiric
- Page 180 and 181:
Chapter 7 - Establishing an empiric
- Page 182 and 183:
Chapter 7 - Establishing an empiric
- Page 184 and 185:
Chapter 7 - Establishing an empiric
- Page 186 and 187:
Chapter 7 - Establishing an empiric
- Page 188 and 189:
Chapter 7 - Establishing an empiric
- Page 190 and 191:
Chapter 7 - Establishing an empiric
- Page 192 and 193:
Chapter 7 - Establishing an empiric
- Page 194 and 195:
Chapter 7 - Establishing an empiric
- Page 196 and 197:
Chapter 7 - Establishing an empiric
- Page 198 and 199:
Chapter 7 - Establishing an empiric
- Page 200 and 201:
Chapter 7 - Establishing an empiric
- Page 202 and 203:
Chapter 7 - Establishing an empiric
- Page 204 and 205:
Chapter 7 - Establishing an empiric
- Page 206 and 207:
Chapter 7 - Establishing an empiric
- Page 208 and 209:
Chapter 8 - Summary, conclusions an
- Page 210 and 211:
Chapter 8 - Summary, conclusions an
- Page 212 and 213:
Chapter 8 - Summary, conclusions an
- Page 214 and 215:
Chapter 8 - Summary, conclusions an
- Page 216 and 217:
Notations K S [m 1/3 /s] roughness
- Page 218 and 219:
Notations bed b bf c cr d e g w o o
- Page 220 and 221:
References de Vriend H.J. (1981). S
- Page 222 and 223:
References Meyer-Peter, E., Favre,
- Page 224 and 225:
References Williams, R. (1899). Flu
- Page 226 and 227:
References by chapter Keulegan (193
- Page 228 and 229:
References by chapter page 214 / No
- Page 230 and 231:
Index of Authors Hoffmanns 13 Hoffm
- Page 232 and 233:
Index of Authors page 218 / Novembe
- Page 234 and 235:
Index of Figures Fig.4.19: Frame po
- Page 236 and 237:
Index of Figures 22] 183 Fig.7.15:
- Page 238 and 239:
Index of Tables Table 7.3: Table of
- Page 240 and 241:
Index of Keywords dimensional analy
- Page 242 and 243:
Index of Keywords sediment sampling
- Page 244 and 245:
Index of Keywords parameter 77 Pete
- Page 246:
Publications (continued) 1997 Hersb