- Page 1 and 2: THE BRIX-FREE WATER CAPACITY AND SO
- Page 3 and 4: dissolved and hydrated waters, and
- Page 5 and 6: ACKNOWLEDGEMENTS I am particularly
- Page 7 and 8: Page 1.5 THE DELETERIOUS EFFECTS OF
- Page 9 and 10: Page 2.2 THE PHENOMENON OF BRIX-FRE
- Page 11 and 12: Page 3.4.3.3 Cane tops 83 3.4.4 Cha
- Page 13 and 14: 4.3.3 Temperature at which Brix-fre
- Page 15 and 16: 4.6.1 Materials 143 4.6.1.1 Samples
- Page 17 and 18: CHAPTER 6. PROPERTIES OF THE SORBED
- Page 19 and 20: APPENDIX 3. CALCULATIONS LEADING TO
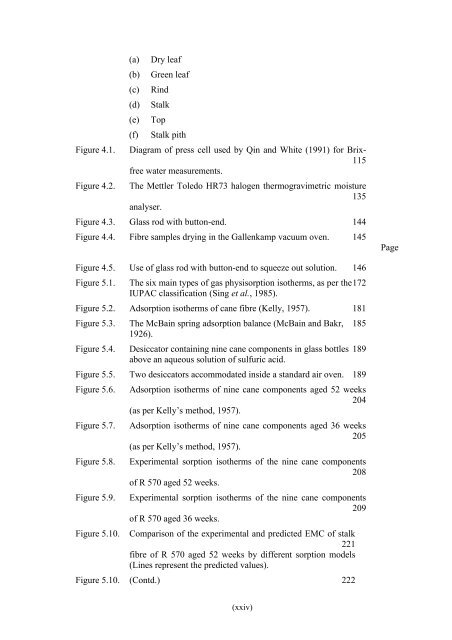
- Page 21 and 22: LIST OF FIGURES Page Figure 1.1. Fi
- Page 23: Figure 3.1. Glucose and fructose an
- Page 27 and 28: total adsorbed water (m) and the pr
- Page 29 and 30: Table 2.18. Moisture content in sug
- Page 31 and 32: Page Table 4.4. Results of the dete
- Page 33 and 34: Page Table 4.24. Analysis of varian
- Page 35 and 36: Page Table 5.13. Table 5.14. Equili
- Page 37 and 38: Table 6.3. Heat of sorption of the
- Page 39 and 40: GLOSSARY OF TERMS Absorption is the
- Page 41 and 42: Filterability of a raw sugar is mea
- Page 43 and 44: Sorption is the generic term used w
- Page 45 and 46: LIST OF MAIN SYMBOLS Symbol Descrip
- Page 47 and 48: s c s Slope of Caurie I isotherm pl
- Page 49 and 50: number of 255, and cane land covere
- Page 51 and 52: Nouvelle Mon In Trésor ustrie and
- Page 53 and 54: Figure 1.3. Cane sampling by core s
- Page 55 and 56: In Mauritius, most of the sugar fac
- Page 57 and 58: are: cane tops, dry and green leave
- Page 59 and 60: 1.4 TRENDS IN CANE QUALITY RECEIVED
- Page 61 and 62: campaign was launched to encourage
- Page 63 and 64: The level of extraneous matter in c
- Page 65 and 66: In Australia (Cargill, 1976), cane
- Page 67 and 68: The effect of soil on factory perfo
- Page 69 and 70: leaves increased the level of impur
- Page 71 and 72: • From 1976 to 1980, when the pro
- Page 73 and 74: Clerget purity of molasses 40 Clerg
- Page 75 and 76:
CHAPTER 2. IMPACT OF EXTRANEOUS MAT
- Page 77 and 78:
Since the extrapolated purity of mo
- Page 79 and 80:
Figure 2.1. Jeffco cutter grinder.
- Page 81 and 82:
2.1.4 Results The analytical result
- Page 83 and 84:
Table 2.3. Analytical results of re
- Page 85 and 86:
Table 2.5. Composition of dry trash
- Page 87 and 88:
Table 2.7. Predicted factory perfor
- Page 89 and 90:
Boiling house recovery 91.0 89.8 89
- Page 91 and 92:
0 5 10 15 20 % EM in cane y = 0.572
- Page 93 and 94:
% EM in cane 0 5 10 15 20 0 -2 -4 -
- Page 95 and 96:
1 y = 0.020 (% D) R 2 = 1.00 = 0.03
- Page 97 and 98:
% EM in cane 0 5 10 15 20 0 -2 y =
- Page 99 and 100:
esulting in 0.015 unit sucrose loss
- Page 101 and 102:
2.2.1 Experimental procedure Cane m
- Page 103 and 104:
filter paper, rejecting the first f
- Page 105 and 106:
Table 2.9. Effect of increased addi
- Page 107 and 108:
Table 2.11. Effect of increased add
- Page 109 and 110:
Table 2.13. Effect of increased add
- Page 111 and 112:
various components such as stalk fi
- Page 113 and 114:
in the presence of dry leaves, if c
- Page 115 and 116:
Table 2.17. Moisture content in sug
- Page 117 and 118:
CHAPTER 3. SEPARATION OF THE SUGAR
- Page 119 and 120:
Table 3.1. It can be seen that the
- Page 121 and 122:
Table 3.2. Fibrous physical composi
- Page 123 and 124:
R 579 R 570 M 1557/70 M 1400/86 74
- Page 125 and 126:
loosen the fibre. The woody core is
- Page 127 and 128:
agitate the mixture in the pot, and
- Page 129 and 130:
Figure 3.7. Custom-built fibre-pith
- Page 131 and 132:
The extraction of fibres starting f
- Page 133 and 134:
pre-treatment in a Jeffco cutter-gr
- Page 135 and 136:
Figure 3.19. Stalk cake washed free
- Page 137 and 138:
not have many dry leaves attached t
- Page 139 and 140:
Table 3.5. Masses of cane samples a
- Page 141 and 142:
Table 3.7. Masses of cane samples a
- Page 143 and 144:
Table 3.9. Masses of cane component
- Page 145 and 146:
3 57.6 126.3 23.7 97.2 31.1 53.8 11
- Page 147 and 148:
Table 3.12. Material loss (%) from
- Page 149 and 150:
3.5.3 Fibre/pith ratios in cane com
- Page 151 and 152:
Table 3.15. Effect of extraneous ma
- Page 153 and 154:
Snow (1974) investigated the season
- Page 155 and 156:
from Figure 2.9 that the change in
- Page 157 and 158:
Table 3.18. Fibre % cane results by
- Page 159 and 160:
110
- Page 161 and 162:
(a). Dry leaf (b). Green leaf (c).
- Page 163 and 164:
dry fibre, or a factor, is used in
- Page 165 and 166:
Steuerwald (1912) applied sucrose s
- Page 167 and 168:
solution/fibre ratio was lowered fr
- Page 169 and 170:
leave some residual moisture on the
- Page 171 and 172:
instead of 150 g of 10° Brix sucro
- Page 173 and 174:
Table 4.2. Determination of Brix-fr
- Page 175 and 176:
Table 4.3. Comparison of Brix-free
- Page 177 and 178:
Table 4.4. Results of the determina
- Page 179 and 180:
In order to test for homogeneity of
- Page 181 and 182:
Table 4.7. Results of the repeat de
- Page 183 and 184:
The experiment was repeated with th
- Page 185 and 186:
e any residual moisture in the samp
- Page 187 and 188:
By means of the same technique, Won
- Page 189 and 190:
was still hot. Since the filter was
- Page 191 and 192:
value determined could be corrected
- Page 193 and 194:
Qin and White’s finding was confi
- Page 195 and 196:
A sample size of 3.5 g with 75 g co
- Page 197 and 198:
Figure 4.4. Fibre samples drying in
- Page 199 and 200:
- One large fibre sample (rind) of
- Page 201 and 202:
Table 4.18. Brix-free water values/
- Page 203 and 204:
Table 4.20. Brix-free water values/
- Page 205 and 206:
4.7.3 Statistical analysis It is es
- Page 207 and 208:
Table 4.23. Analysis of variance (B
- Page 209 and 210:
pointing out that at 52 weeks old,
- Page 211 and 212:
The crop of R 570 sampled in 2001 w
- Page 213 and 214:
4.7.4. Estimated Brix-free water co
- Page 215 and 216:
The main difference in the two sets
- Page 217 and 218:
Table 4.27. Predicted Brix-free wat
- Page 219 and 220:
4.8 SUMMARY AND CONCLUSIONS An anal
- Page 221 and 222:
component parts, and verify the Bri
- Page 223 and 224:
3) Thermodynamic, water in equilibr
- Page 225 and 226:
Langmuir (1916, 1917, 1918) propose
- Page 227 and 228:
to determine the moisture sorption
- Page 229 and 230:
Table 5.1. Some commonly used isoth
- Page 231 and 232:
Lomauro et al. (1985) found that wi
- Page 233 and 234:
and on agricultural products such a
- Page 235 and 236:
Bruijn (1963) studied the mass incr
- Page 237 and 238:
After measuring the EMC of dry corn
- Page 239 and 240:
approached, that is, either by adso
- Page 241 and 242:
Table 5.4. Water activity (a w ) of
- Page 243 and 244:
5.6.3 Procedure to determine equili
- Page 245 and 246:
5.6.4 Results and discussion An exa
- Page 247 and 248:
Table 5.8. Equilibrium moisture con
- Page 249 and 250:
Table 5.10. Equilibrium moisture co
- Page 251 and 252:
Table 5.12. Equilibrium moisture co
- Page 253 and 254:
30 o C 45 o C 55 o C 60 o C Water w
- Page 255 and 256:
m/m of 96% activity, a w (g/100g dr
- Page 257 and 258:
vaporisation generally decreases fr
- Page 259 and 260:
30 o C isotherm 45 o C isotherm 55
- Page 261 and 262:
4 0 Stalk fibre 5 0 Stalk pith 5 0
- Page 263 and 264:
5.6.4.4 Fitting of sorption models
- Page 265 and 266:
Table 5.19. Parameters of the sorpt
- Page 267 and 268:
Table 5.21. Parameters of the sorpt
- Page 269 and 270:
Table 5.23. Parameters of the sorpt
- Page 271 and 272:
Table 5.25. Parameters of the sorpt
- Page 273 and 274:
Table 5.27. Parameters of the sorpt
- Page 275 and 276:
Modified GAB Kuhn Iglesias - Chirif
- Page 277 and 278:
Table 5.28. Classification of resid
- Page 279 and 280:
Stalk fibre Stalk pith Rind fibre 4
- Page 281 and 282:
5.6.4.5 Calculated EMC values of re
- Page 283 and 284:
Table 5.30. Calculated equilibrium
- Page 285 and 286:
m/m of 96% Table 5.32. Calculated e
- Page 287 and 288:
Table 5.33. Parameters of the Hailw
- Page 289 and 290:
CHAPTER 6. PROPERTIES OF THE SORBED
- Page 291 and 292:
where m is the equilibrium moisture
- Page 293 and 294:
Stalk fibre Stalk pith Rind fibre 8
- Page 295 and 296:
Stalk fibre Stalk pith Rind fibre 4
- Page 297 and 298:
6.2 THE NUMBER OF ADSORBED MONOLAYE
- Page 299 and 300:
6.3 TOTAL SOLID SURFACE AREA AVAILA
- Page 301 and 302:
Thus, for each cane component of ea
- Page 303 and 304:
abscissa. For each moisture level (
- Page 305 and 306:
Stalk fibre Stalk pith Rind fibre 1
- Page 307 and 308:
A similar procedure was followed to
- Page 309 and 310:
10 0 Stalk fibre Stalk pith Rind fi
- Page 311 and 312:
Moreover, if T β > T hm the proces
- Page 313 and 314:
Table 6.5. Characteristic parameter
- Page 315 and 316:
Binding energy/kJ (kg mol) -1 2 0 0
- Page 317 and 318:
6.8 CALCULATION OF BOUND WATER AND
- Page 319 and 320:
The values of K 1 , K 2 and W were
- Page 321 and 322:
Table 6.7. Separation of the total
- Page 323 and 324:
Table 6.7. (Contd.) Sample 30 o C 4
- Page 325 and 326:
3 0 S talk fibre 4 0 Stalk pith 3 0
- Page 327 and 328:
3 0 Reconstituted cane at 30 o C 3
- Page 329 and 330:
when water is added to dry wood, wh
- Page 331 and 332:
It is evident that in some cases ma
- Page 333 and 334:
The number of adsorbed monolayers,
- Page 335 and 336:
Data in Tables 2.9 and 2.11 show th
- Page 337 and 338:
particular fibre is systematically
- Page 339 and 340:
Anon. (1985b). Laboratory manual fo
- Page 341 and 342:
Blanchi R.H. and A.G. Keller (1952)
- Page 343 and 344:
Day D.L. and G.L. Nelson (1965). De
- Page 345 and 346:
Heyrovsky J. (1970). Determination
- Page 347 and 348:
Kuhn I.J. (1964). A new theoretical
- Page 349 and 350:
Madamba P.S., R.H. Driscoll and K.A
- Page 351 and 352:
Prinsen Geerligs, H.C. (1897). Stud
- Page 353 and 354:
Sing K.S.W., D.H. Everett, R.A.W. H
- Page 355 and 356:
Van der Pol C., C.M. Young and K. D


