Kinetic Analysis and Characterization of Epoxy Resins ... - FedOA
Kinetic Analysis and Characterization of Epoxy Resins ... - FedOA
Kinetic Analysis and Characterization of Epoxy Resins ... - FedOA

Create successful ePaper yourself
Turn your PDF publications into a flip-book with our unique Google optimized e-Paper software.
Results <strong>and</strong> Discussion 117<br />
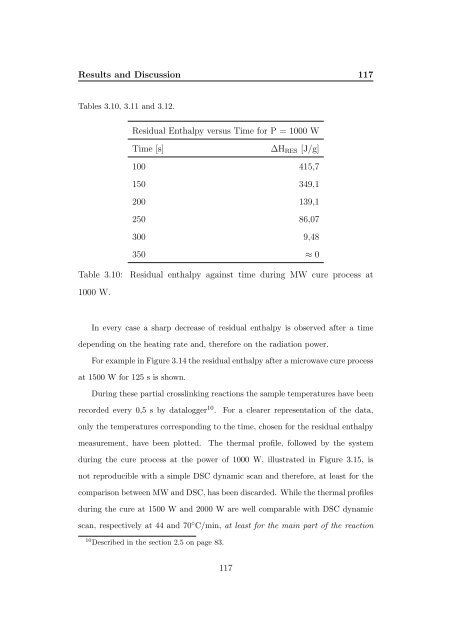
Tables 3.10, 3.11 <strong>and</strong> 3.12.<br />
Residual Enthalpy versus Time for P = 1000 W<br />
Time [s]<br />
∆H RES [J/g]<br />
100 415,7<br />
150 349,1<br />
200 139,1<br />
250 86,07<br />
300 9,48<br />
350 ≈ 0<br />
Table 3.10:<br />
Residual enthalpy against time during MW cure process at<br />
1000 W.<br />
In every case a sharp decrease <strong>of</strong> residual enthalpy is observed after a time<br />
depending on the heating rate <strong>and</strong>, therefore on the radiation power.<br />
For example in Figure 3.14 the residual enthalpy after a microwave cure process<br />
at 1500 W for 125 s is shown.<br />
During these partial crosslinking reactions the sample temperatures have been<br />
recorded every 0,5 s by datalogger 10 .<br />
For a clearer representation <strong>of</strong> the data,<br />
only the temperatures corresponding to the time, chosen for the residual enthalpy<br />
measurement, have been plotted.<br />
The thermal pr<strong>of</strong>ile, followed by the system<br />
during the cure process at the power <strong>of</strong> 1000 W, illustrated in Figure 3.15, is<br />
not reproducible with a simple DSC dynamic scan <strong>and</strong> therefore, at least for the<br />
comparison between MW <strong>and</strong> DSC, has been discarded. While the thermal pr<strong>of</strong>iles<br />
during the cure at 1500 W <strong>and</strong> 2000 W are well comparable with DSC dynamic<br />
scan, respectively at 44 <strong>and</strong> 70 ◦ C/min, at least for the main part <strong>of</strong> the reaction<br />
10 Described in the section 2.5 on page 83.<br />
117