Kinetic Analysis and Characterization of Epoxy Resins ... - FedOA
Kinetic Analysis and Characterization of Epoxy Resins ... - FedOA
Kinetic Analysis and Characterization of Epoxy Resins ... - FedOA
Create successful ePaper yourself
Turn your PDF publications into a flip-book with our unique Google optimized e-Paper software.
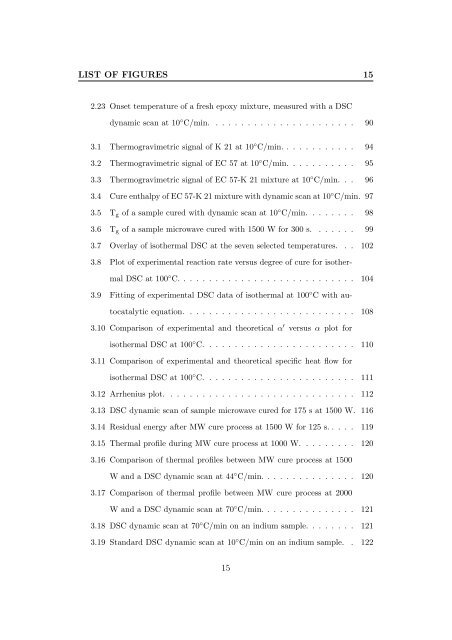
LIST OF FIGURES 15<br />
2.23 Onset temperature <strong>of</strong> a fresh epoxy mixture, measured with a DSC<br />
dynamic scan at 10 ◦ C/min. ...................... 90<br />
3.1 Thermogravimetric signal <strong>of</strong> K 21 at 10 ◦ C/min............ 94<br />
3.2 Thermogravimetric signal <strong>of</strong> EC 57 at 10 ◦ C/min........... 95<br />
3.3 Thermogravimetric signal <strong>of</strong> EC 57-K 21 mixture at 10 ◦ C/min. . . 96<br />
3.4 Cure enthalpy <strong>of</strong> EC 57-K 21 mixture with dynamic scan at 10 ◦ C/min. 97<br />
3.5 T g <strong>of</strong> a sample cured with dynamic scan at 10 ◦ C/min........ 98<br />
3.6 T g <strong>of</strong> a sample microwave cured with 1500 W for 300 s. . . . . . . 99<br />
3.7 Overlay <strong>of</strong> isothermal DSC at the seven selected temperatures. . . 102<br />
3.8 Plot <strong>of</strong> experimental reaction rate versus degree <strong>of</strong> cure for isothermal<br />
DSC at 100 ◦ C............................ 104<br />
3.9 Fitting <strong>of</strong> experimental DSC data <strong>of</strong> isothermal at 100 ◦ Cwithautocatalyticequation.<br />
.......................... 108<br />
3.10 Comparison <strong>of</strong> experimental <strong>and</strong> theoretical α ′ versus α plot for<br />
isothermal DSC at 100 ◦ C........................ 110<br />
3.11 Comparison <strong>of</strong> experimental <strong>and</strong> theoretical specific heat flow for<br />
isothermal DSC at 100 ◦ C........................ 111<br />
3.12Arrheniusplot. ............................. 112<br />
3.13 DSC dynamic scan <strong>of</strong> sample microwave cured for 175 s at 1500 W. 116<br />
3.14 Residual energy after MW cure process at 1500 W for 125 s. . . . . 119<br />
3.15 Thermal pr<strong>of</strong>ile during MW cure process at 1000 W. . . . . . . . . 120<br />
3.16 Comparison <strong>of</strong> thermal pr<strong>of</strong>iles between MW cure process at 1500<br />
W <strong>and</strong> a DSC dynamic scan at 44 ◦ C/min............... 120<br />
3.17 Comparison <strong>of</strong> thermal pr<strong>of</strong>ile between MW cure process at 2000<br />
W <strong>and</strong> a DSC dynamic scan at 70 ◦ C/min............... 121<br />
3.18 DSC dynamic scan at 70 ◦ C/min on an indium sample. . . . . . . . 121<br />
3.19 St<strong>and</strong>ard DSC dynamic scan at 10 ◦ C/min on an indium sample. . 122<br />
15


