We aim to be the most preferred non-life insurer in Thailand
We aim to be the most preferred non-life insurer in Thailand
We aim to be the most preferred non-life insurer in Thailand

You also want an ePaper? Increase the reach of your titles
YUMPU automatically turns print PDFs into web optimized ePapers that Google loves.
As a consequence, it is anticipated that <strong>non</strong>-<strong>life</strong> <strong>in</strong>surance companies will still give importance <strong>to</strong> expand<strong>in</strong>g <strong>the</strong>ir market<br />
via issu<strong>in</strong>g economical - price policies, especially “2 Plus”, “3 Plus”, and “Third Liability” mo<strong>to</strong>r <strong>in</strong>surance policies, correspond<strong>in</strong>g<br />
<strong>to</strong> market demand. However, under <strong>the</strong> current uncerta<strong>in</strong> economic condition, <strong>non</strong>-<strong>life</strong> <strong>in</strong>surance companies will still <strong>be</strong> more<br />
cautious and str<strong>in</strong>gent <strong>in</strong> <strong>the</strong>ir scrut<strong>in</strong>y for underwrit<strong>in</strong>g and cl<strong>aim</strong>s payment.<br />
Ability <strong>to</strong> Ma<strong>in</strong>ta<strong>in</strong> Ratios Based on Bus<strong>in</strong>ess Type<br />
In 2009, <strong>the</strong> Company had a <strong>to</strong>tal written premium of Baht 8,796.7 million, with premium growth <strong>in</strong> nearly all classes of<br />
<strong>in</strong>surance, except mar<strong>in</strong>e cargo <strong>in</strong>surance, which experienced slightly decreas<strong>in</strong>g growth correspond<strong>in</strong>g <strong>to</strong> <strong>the</strong> market. The mo<strong>to</strong>r<br />
premium amounted <strong>to</strong> Baht 3,210.3 million, represent<strong>in</strong>g 36.5 percent of <strong>the</strong> <strong>to</strong>tal written premium, with a constantly dim<strong>in</strong>ish<strong>in</strong>g<br />
trend of ratio <strong>be</strong>tween 2007 - 2009. Meanwhile, a <strong>to</strong>tal written premium for o<strong>the</strong>r classes of <strong>in</strong>surance <strong>be</strong>sides mo<strong>to</strong>r <strong>in</strong>surance<br />
accounted for Baht 5,586.4 million, or 63.5 percent of <strong>the</strong> <strong>to</strong>tal written premium, compared <strong>to</strong> 61.6 percent <strong>in</strong> 2008. This was partly<br />
due <strong>to</strong> <strong>the</strong> Company’s ability <strong>to</strong> achieve a high growth rate of its miscellaneous premium, especially for personal accident<br />
<strong>in</strong>surance, which experienced a very high growth rate. In contrast, fire <strong>in</strong>surance, with a slight loss ratio, witnessed an approximate<br />
ratio over <strong>the</strong> past three years, or around 17 percent of <strong>the</strong> <strong>to</strong>tal written premium.<br />
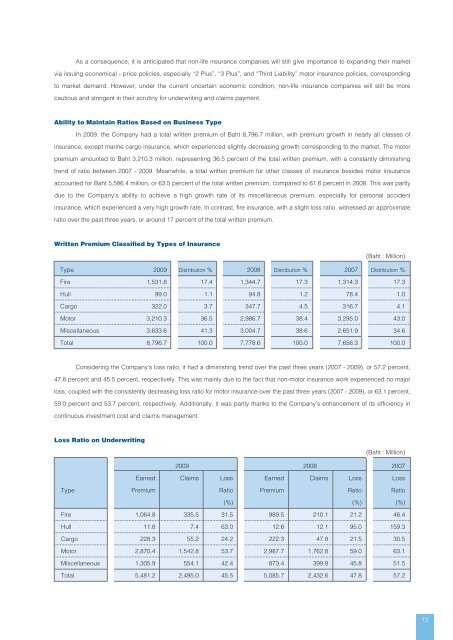
Written Premium Classified by Types of Insurance<br />
(Baht : Million)<br />
Type 2009 Distribution % 2008 Distribution % 2007 Distribution %<br />
Fire 1,531.8 17.4 1,344.7 17.3 1,314.3 17.3<br />
Hull 99.0 1.1 94.8 1.2 78.4 1.0<br />
Cargo 322.0 3.7 347.7 4.5 316.7 4.1<br />
Mo<strong>to</strong>r 3,210.3 36.5 2,986.7 38.4 3,295.0 43.0<br />
Miscellaneous 3,633.6 41.3 3,004.7 38.6 2,651.9 34.6<br />
Total 8,796.7 100.0 7,778.6 100.0 7,656.3 100.0<br />
Consider<strong>in</strong>g <strong>the</strong> Company’s loss ratio, it had a dim<strong>in</strong>ish<strong>in</strong>g trend over <strong>the</strong> past three years (2007 - 2009), or 57.2 percent,<br />
47.8 percent and 45.5 percent, respectively. This was ma<strong>in</strong>ly due <strong>to</strong> <strong>the</strong> fact that <strong>non</strong>-mo<strong>to</strong>r <strong>in</strong>surance work experienced no major<br />
loss, coupled with <strong>the</strong> consistently decreas<strong>in</strong>g loss ratio for mo<strong>to</strong>r <strong>in</strong>surance over <strong>the</strong> past three years (2007 - 2009), or 63.1 percent,<br />
59.0 percent and 53.7 percent, respectively. Additionally, it was partly thanks <strong>to</strong> <strong>the</strong> Company’s enhancement of its efficiency <strong>in</strong><br />
cont<strong>in</strong>uous <strong>in</strong>vestment cost and cl<strong>aim</strong>s management.<br />
Loss Ratio on Underwrit<strong>in</strong>g<br />
(Baht : Million)<br />
2009 2008 2007<br />
Earned Cl<strong>aim</strong>s Loss Earned Cl<strong>aim</strong>s Loss Loss<br />
Type Premium Ratio Premium Ratio Ratio<br />
(%) (%) (%)<br />
Fire 1,064.8 335.5 31.5 989.5 210.1 21.2 46.4<br />
Hull 11.8 7.4 63.0 12.8 12.1 95.0 159.3<br />
Cargo 228.3 55.2 24.2 222.3 47.8 21.5 30.5<br />
Mo<strong>to</strong>r 2,870.4 1,542.8 53.7 2,987.7 1,762.8 59.0 63.1<br />
Miscellaneous 1,305.9 554.1 42.4 873.4 399.8 45.8 51.5<br />
Total 5,481.2 2,495.0 45.5 5,085.7 2,432.6 47.8 57.2<br />
13