We aim to be the most preferred non-life insurer in Thailand
We aim to be the most preferred non-life insurer in Thailand
We aim to be the most preferred non-life insurer in Thailand

Create successful ePaper yourself
Turn your PDF publications into a flip-book with our unique Google optimized e-Paper software.
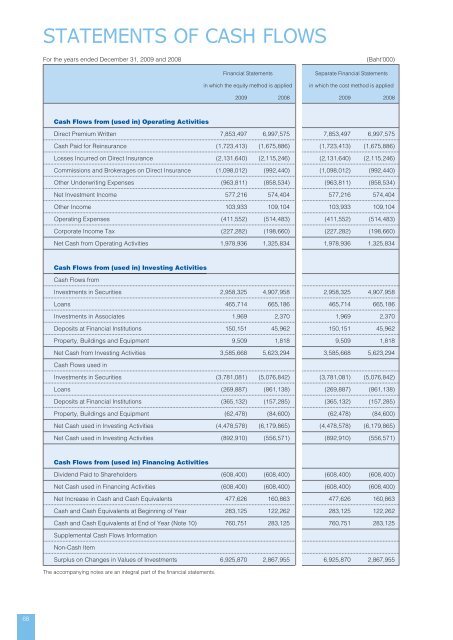
STATEMENTS OF CASH FLOWS<br />
For <strong>the</strong> years ended Decem<strong>be</strong>r 31, 2009 and 2008<br />
(Baht’000)<br />
F<strong>in</strong>ancial Statements<br />
<strong>in</strong> which <strong>the</strong> equity method is applied<br />
Separate F<strong>in</strong>ancial Statements<br />
<strong>in</strong> which <strong>the</strong> cost method is applied<br />
2009 2008 2009 2008<br />
Cash Flows from (used <strong>in</strong>) Operat<strong>in</strong>g Activities<br />
Direct Premium Written 7,853,497 6,997,575 7,853,497 6,997,575<br />
Cash Paid for Re<strong>in</strong>surance (1,723,413) (1,675,886) (1,723,413) (1,675,886)<br />
Losses Incurred on Direct Insurance (2,131,640) (2,115,246) (2,131,640) (2,115,246)<br />
Commissions and Brokerages on Direct Insurance (1,098,012) (992,440) (1,098,012) (992,440)<br />
O<strong>the</strong>r Underwrit<strong>in</strong>g Expenses (963,811) (858,534) (963,811) (858,534)<br />
Net Investment Income 577,216 574,404 577,216 574,404<br />
O<strong>the</strong>r Income 103,933 109,104 103,933 109,104<br />
Operat<strong>in</strong>g Expenses (411,552) (514,483) (411,552) (514,483)<br />
Corporate Income Tax (227,282) (198,660) (227,282) (198,660)<br />
Net Cash from Operat<strong>in</strong>g Activities 1,978,936 1,325,834 1,978,936 1,325,834<br />
Cash Flows from (used <strong>in</strong>) Invest<strong>in</strong>g Activities<br />
Cash Flows from<br />
Investments <strong>in</strong> Securities 2,958,325 4,907,958 2,958,325 4,907,958<br />
Loans 465,714 665,186 465,714 665,186<br />
Investments <strong>in</strong> Associates 1,969 2,370 1,969 2,370<br />
Deposits at F<strong>in</strong>ancial Institutions 150,151 45,962 150,151 45,962<br />
Property, Build<strong>in</strong>gs and Equipment 9,509 1,818 9,509 1,818<br />
Net Cash from Invest<strong>in</strong>g Activities 3,585,668 5,623,294 3,585,668 5,623,294<br />
Cash Flows used <strong>in</strong><br />
Investments <strong>in</strong> Securities (3,781,081) (5,076,842) (3,781,081) (5,076,842)<br />
Loans (269,887) (861,138) (269,887) (861,138)<br />
Deposits at F<strong>in</strong>ancial Institutions (365,132) (157,285) (365,132) (157,285)<br />
Property, Build<strong>in</strong>gs and Equipment (62,478) (84,600) (62,478) (84,600)<br />
Net Cash used <strong>in</strong> Invest<strong>in</strong>g Activities (4,478,578) (6,179,865) (4,478,578) (6,179,865)<br />
Net Cash used <strong>in</strong> Invest<strong>in</strong>g Activities (892,910) (556,571) (892,910) (556,571)<br />
Cash Flows from (used <strong>in</strong>) F<strong>in</strong>anc<strong>in</strong>g Activities<br />
Dividend Paid <strong>to</strong> Shareholders (608,400) (608,400) (608,400) (608,400)<br />
Net Cash used <strong>in</strong> F<strong>in</strong>anc<strong>in</strong>g Activities (608,400) (608,400) (608,400) (608,400)<br />
Net Increase <strong>in</strong> Cash and Cash Equivalents 477,626 160,863 477,626 160,863<br />
Cash and Cash Equivalents at Beg<strong>in</strong>n<strong>in</strong>g of Year 283,125 122,262 283,125 122,262<br />
Cash and Cash Equivalents at End of Year (Note 10) 760,751 283,125 760,751 283,125<br />
Supplemental Cash Flows Information<br />
Non-Cash Item<br />
Surplus on Changes <strong>in</strong> Values of Investments 6,925,870 2,867,955 6,925,870 2,867,955<br />
The accompany<strong>in</strong>g notes are an <strong>in</strong>tegral part of <strong>the</strong> f<strong>in</strong>ancial statements.<br />
68