- Page 1 and 2:
PATTERNS OF POPULATION GROWTH IN NE
- Page 3 and 4:
DECLARATION ----------- I hereby de
- Page 5 and 6:
I acknowledge my gratitude to the I
- Page 7 and 8:
CON TEN T S ACKNO\tv"LEDGEMENT LIST
- Page 9 and 10:
vi Page CHAPTER VIII: LEVELS OF SOC
- Page 11 and 12:
viii Table No. 5.4 5.5 Rate of Tota
- Page 13 and 14:
Map No. LIST OF MAPS Page 3.1 Nepal
- Page 15 and 16:
CHAPTER I INTRODUCTION 1.1 Backgrou
- Page 17 and 18:
3 of 3.2 per cent per annum. What i
- Page 19 and 20:
5 level has increased and per cent
- Page 21 and 22:
., components of population growth
- Page 23 and 24:
9 with reference to specific compon
- Page 25 and 26:
11 Chapter Eight examines the patte
- Page 27 and 28:
CHAPTER II ME'lHOOOWGY In the prese
- Page 29 and 30:
14 (ii) '!he number of children bor
- Page 31 and 32:
16 development. 21 indicators have
- Page 33 and 34:
figures wi thin the same ecological
- Page 35 and 36:
20 2.3 Techniques of Analysis: In t
- Page 37 and 38:
economic development is that it doe
- Page 39 and 40:
CliAPTER III POPULATION GROH'lH IN
- Page 41 and 42:
25 (ii) the Hill region, and (iii)
- Page 43 and 44:
27 Nepal has an ethnically complex
- Page 45 and 46:
29 end of the 16th Century. Similar
- Page 47 and 48:
31 ferm or the other prevailed even
- Page 49 and 50:
I 33 ~ , 3.4 Population in the Pres
- Page 51 and 52:
1 SEC UeRJRY 8 lNG 6 l()RE A~. N _.
- Page 53 and 54:
Natural Regions Area in Percent Pop
- Page 55 and 56:
39 From the table it is also eviden
- Page 57 and 58:
QiAPTER IV BEHAVIOUR OF THE COMPONE
- Page 59 and 60:
42 techniques to obtain plausible e
- Page 61 and 62:
., deaths which occurred during the
- Page 63 and 64:
46 Gubhaju's estimates of 42.9 for
- Page 65 and 66:
48 such as doctors, nurses and m1d\
- Page 67 and 68:
'" , f 50 ., ~ .( 4.2 Fertility 2a.
- Page 69 and 70:
52 In order to obtain the most plau
- Page 71 and 72:
Table 4,31 Age-~ecific Fertili~ Rat
- Page 73 and 74:
56 ~le 4.41 l-'!ean Number of Child
- Page 75 and 76:
58 singulate mean age at marriage f
- Page 77 and 78:
TaJ:Ue 4.:>1 percengge D1Stl10UCIOi
- Page 79 and 80:
62 Table 4.6: Percentage of Current
- Page 81 and 82:
.A.g....., ... 'Q" -...,. .......::
- Page 83 and 84:
66 survey conducted in 1983 reveale
- Page 85 and 86:
68 A survey conducted in 1983 revea
- Page 87 and 88:
CHAPTER V REGIONAL PATTERNS OF POPU
- Page 89 and 90:
71 5.1 Patterns of Population Gro\l
- Page 91 and 92:
73 regions, Hill region has experie
- Page 93 and 94:
./'J" r~·· l." /w EST E! ~ N ~. "
- Page 95 and 96:
77 Annual Intercensal Gro~th Rate (
- Page 97 and 98:
79 All the three sub-regions in Ter
- Page 99 and 100:
81 been considered as a representat
- Page 101 and 102:
83 deaths duzing 1971-81 were again
- Page 103 and 104:
85 Table 5.3: Rate of Total Increas
- Page 105 and 106:
87 Table 5.3 (contd •• ) 51. No
- Page 107 and 108:
89 Table 5.4: Rate of Total Increas
- Page 109 and 110:
91 in Central Mountain. It should b
- Page 111 and 112:
93 Across regions the RTI varies fr
- Page 113 and 114:
- 1 1 i !; ~ I I ] :! . 0 a 0 • ~
- Page 115 and 116:
MAP £0.4 . . . ... . . . . ,-. ~:.
- Page 117 and 118:
Type Patterns of Population Change
- Page 119 and 120:
101 Entire Terai, Central and Weste
- Page 121 and 122:
103 From the above discussion it is
- Page 123 and 124:
CHAPTER VI LEVELS OF AGRICULTURAL D
- Page 125 and 126:
106 population growth and its compo
- Page 127 and 128:
108 changes in life style together:
- Page 129 and 130:
110 2. Agricultural development lea
- Page 131 and 132:
112 area (Seetharam,1971; Rao and S
- Page 133 and 134:
114 natu~al inc~ease in population
- Page 135 and 136:
116 rate due to the increase in agr
- Page 137 and 138:
118 mechanization has a negative ef
- Page 139 and 140:
120 A Study by Mitra and Mukherji (
- Page 141 and 142:
122 required by the industrial sect
- Page 143 and 144:
124 thus showing an addition of 1,1
- Page 145 and 146:
126 Census of Agriculture in 1981 s
- Page 147 and 148:
Ind:1cators 1961_62 a 1964-6S b 196
- Page 149 and 150:
130 6.6 Selection of Indicators of
- Page 151 and 152: Tab1e 6.21 Rotated Factor ~oad~ngs
- Page 153 and 154: 134 development of the district aro
- Page 155 and 156: 136 categories based on first facto
- Page 157 and 158: Z5!E!5!:::E" '01:::11_ E;P:.:;;;aIC
- Page 159 and 160: 140 respectively. Thus, it may be s
- Page 161 and 162: 142 exhibiting high levels of agric
- Page 163 and 164: 144 In order to substantiate our fi
- Page 165 and 166: 146 natural increase, rate of net m
- Page 167 and 168: 148 Appendix 6-1 (contd •• ) 1
- Page 169 and 170: CHAPTER VII PATTERNS OF URBAN POPUL
- Page 171 and 172: - 151 The objective of this chapter
- Page 173 and 174: 153 economies of scale in many econ
- Page 175 and 176: 155 7.3 Empirical Findings f;om Oth
- Page 177 and 178: 157 Zarate (1967) used the Mexican
- Page 179 and 180: 159 (ii) industrial development and
- Page 181 and 182: '161 7.4 Levels and Trends of Urban
- Page 183 and 184: .:. 163 Table 7.1: Percentage Distr
- Page 185 and 186: 165 in a given size class of cities
- Page 187 and 188: 167 compared to other size classes
- Page 189 and 190: 169 7.5 Growth of Towns: The number
- Page 191 and 192: 171 units i.e., towns, it is diffie
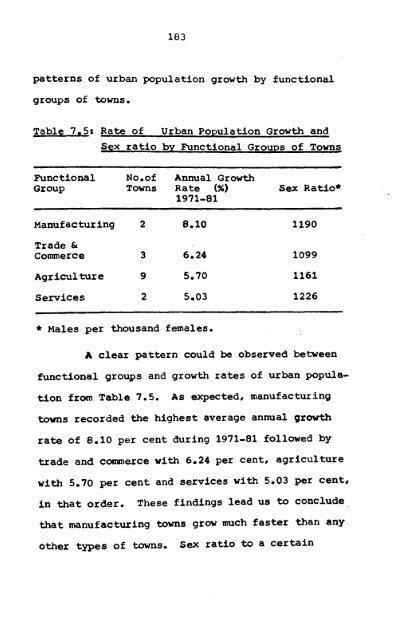
- Page 193 and 194: 173 recorded a highest annual growt
- Page 195 and 196: 175 A fe\-l more towns are also exp
- Page 197 and 198: 177 (ii) Mining, (iii) Manufacturin
- Page 199 and 200: 179 fo~ce to each of the ~emaining
- Page 201: 181 Table 7!4: Towns Functional Cla
- Page 205 and 206: 185 making transport as a separate
- Page 207 and 208: 187 one town falling in the multifu
- Page 209 and 210: CHAPTER VI I I LEVELS OF SOCIO-ECON
- Page 211 and 212: 190 Based on conceptual framework,
- Page 213 and 214: 192 will lead to reduction in ferti
- Page 215 and 216: 194 couple due to the uncertainties
- Page 217 and 218: 196 It has been widely accepted tha
- Page 219 and 220: 198 redistribution of population fr
- Page 221 and 222: 200 an inverse relationship between
- Page 223 and 224: 202 A large number of studies have
- Page 225 and 226: 204 Farooq and Tuncer (1974) while
- Page 227 and 228: 206 increasing use of contraceptive
- Page 229 and 230: 208 Yang and Pendleton (1980) in th
- Page 231 and 232: 210 explained by levels of economic
- Page 233 and 234: 212 this was mostly explained by hi
- Page 235 and 236: 214 negative association between in
- Page 237 and 238: 216 However, considerable changes h
- Page 239 and 240: 218 Table 8.1 (contd •• ) Indic
- Page 241 and 242: 220 11(b) 11(c) Ram Bahadur K.C. "D
- Page 243 and 244: 222 very common, epidemic disease l
- Page 245 and 246: 224 due to its physical setting int
- Page 247 and 248: 226 1. Cultivated area per agricult
- Page 249 and 250: Tab1e 8.21 Rotated Factor Load~n95
- Page 251 and 252: Tab~e 8.21 (contd •• ) I Variab
- Page 253 and 254:
232 which record low/negative facto
- Page 255 and 256:
- ,..r: .... ::. .: ...... . - / ..
- Page 257 and 258:
Table 8Ll' Distribution of District
- Page 259 and 260:
238 8.8 Socio-Economic Development
- Page 261 and 262:
240 levels of socio-economic develo
- Page 263 and 264:
242 Our above findings have been fu
- Page 265 and 266:
244 coefficients bet\veen Factor 2
- Page 267 and 268:
246 APPENDIX 8·1 (contd •• ) 1
- Page 269 and 270:
248 APPENDIX 8·.1 (contd •••
- Page 271 and 272:
CHAPTER IX SUMMARY AND CONCLUSION
- Page 273 and 274:
251 Many studies have examined the
- Page 275 and 276:
253 increase in the supply of piped
- Page 277 and 278:
255 net migration. Based on the var
- Page 279 and 280:
257 was in the expected direction s
- Page 281 and 282:
259 need for reducing the dispariti
- Page 283 and 284:
261 cross-national analysis, United
- Page 285 and 286:
Table 9.1 (contd •• ) 1 2 3 4 5
- Page 287 and 288:
265 uphill task in Nepal. Thus, acc
- Page 289 and 290:
267 areas. Family planning alone ma
- Page 291 and 292:
BIBLIOGRAPHY
- Page 293 and 294:
(ii) Berlson,B. and Mauldin,W.Parke
- Page 295 and 296:
(iv) Central Bureau of Statistics (
- Page 297 and 298:
D'Souza,Victor s. : (1983) Ekanem,I
- Page 299 and 300:
Gurung, Harkha (1981) Hagood,A.L. (
- Page 301 and 302:
Kirk,D. (1971) Kirkpatrick, Colonel
- Page 303 and 304:
McNicoll,G. and Singarimbun,M. (198
- Page 305 and 306:
(xiv) Poffenberger, Mark (1980) Pre
- Page 307 and 308:
(xvi) Sxikantan,K.S. (1977) Sxiniva
- Page 309 and 310:
Uni ted Nations (1979) ________ , (