Global Steel Trade; Structural Problems and Future Solutions
Global Steel Trade; Structural Problems and Future Solutions
Global Steel Trade; Structural Problems and Future Solutions

Create successful ePaper yourself
Turn your PDF publications into a flip-book with our unique Google optimized e-Paper software.
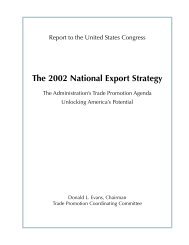
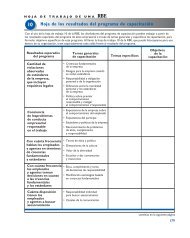
9.2%<br />
22.5%<br />
1997 1998 1999<br />
Asia Europe United States<br />
Latin America Other<br />
Source: World <strong>Trade</strong> Atlas.<br />
3.5%<br />
17.7%<br />
27.8%<br />
32.6%<br />
7.9%<br />
8.2%<br />
5.2%<br />
19.7%<br />
16.8% 25.5%<br />
25.9% 16.4% 15.5%<br />
37.0%<br />
29.9%<br />
3-41. Brazil—Distribution of Total Exports (1997–1999)<br />
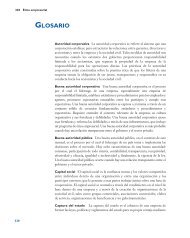
32.6%<br />
42.2%<br />
4.0%<br />
2.7%<br />
30.8%<br />
11.5%<br />
41.7%<br />
13.2%<br />
6.3%<br />
4.6%<br />
31.6%<br />
1997 1998 1999<br />
Asia Europe United States<br />
15.3%<br />
42.2%<br />
While overall U.S. steel<br />
imports from Brazil declined<br />
from 1997 to 1998 (mainly<br />
due to a decline in<br />
semifinished steel imports),<br />
imports for some product<br />
categories increased. Hotrolled<br />
steel exports to the<br />
United States increased by<br />
67,000 MT, or roughly 17<br />
percent in 1998. 41 From 1997<br />
to 1998, the percentage of<br />
Brazil’s hot-rolled exports<br />
shipped to the United States<br />
grew from roughly 33 percent<br />
to more than 41 percent.<br />
Meanwhile, exports of coldrolled<br />
steel to the United<br />
States nearly doubled<br />
between 1997 <strong>and</strong> 1998,<br />
climbing from 122,000 MT to<br />
225,000 MT, representing an<br />
increase in the percentage of<br />
Brazil’s total cold-rolled<br />
exports going to the United<br />
States from 45 percent in<br />
1997 to 59 percent in 1998 42<br />
(Chart 3-43). 43<br />
Efforts to Maintain<br />
Export Levels to the<br />
United States<br />
Latin America<br />
Source: World <strong>Trade</strong> Atlas.<br />
Other<br />
With the collapse of dem<strong>and</strong> in<br />
its most important export<br />
market <strong>and</strong> the sudden decline<br />
of dem<strong>and</strong> at home, Brazilian<br />
3-42: Brazil—Distribution of Hot-Rolled <strong>Steel</strong> Exports (1997–1999) steel producers cut their U.S.<br />
dollar export prices for certain products to retain export levels <strong>and</strong> maintain production <strong>and</strong> capacity levels.<br />
In 1998, almost 26 million MT of crude steel were produced, a decline of just 1.5 percent from the<br />
previous year. 44 Sales in the United States remained profitable because companies were able to cut prices<br />
in line with the depreciation of the Brazilian real. Despite rapidly dropping U.S. prices, especially in the<br />
second half of 1998, the consistent depreciation of the real during 1998 kept pace with the U.S. dollar<br />
price declines <strong>and</strong> allowed Brazilian producers to generally maintain their revenues in real terms on U.S.<br />
sales. In 1998, Brazil’s largest steel producers were profitable, 45 although their net profits did decrease<br />
from 1997 levels.<br />
Between December 1997 <strong>and</strong> December 1998, the average unit value of imports of carbon hot-rolled<br />
steel 46 from Brazil dropped from $324 per MT 47 to $263 per MT (Chart 3-44). Similarly, during the<br />
same period, the price of imported carbon cold-rolled steel from Brazil dropped from $441 per MT to<br />
$323 per MT. 48 Imports of carbon semifinished steel experienced a similar pricing decline. Because<br />
104 <strong>Global</strong> <strong>Steel</strong> <strong>Trade</strong>: <strong>Structural</strong> <strong>Problems</strong> <strong>and</strong> <strong>Future</strong> <strong>Solutions</strong>