Global Steel Trade; Structural Problems and Future Solutions
Global Steel Trade; Structural Problems and Future Solutions
Global Steel Trade; Structural Problems and Future Solutions

You also want an ePaper? Increase the reach of your titles
YUMPU automatically turns print PDFs into web optimized ePapers that Google loves.
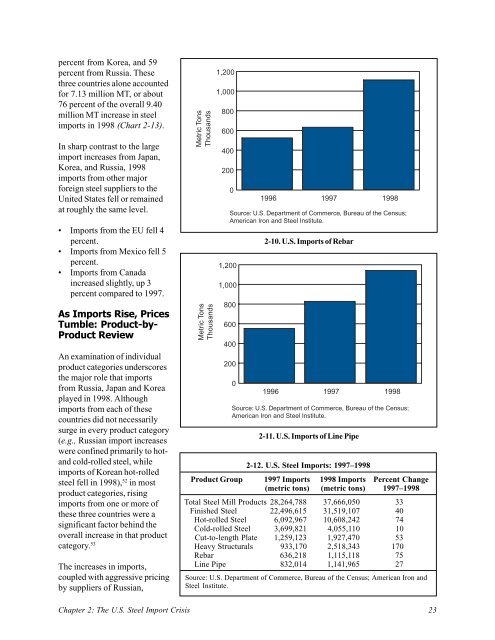
percent from Korea, <strong>and</strong> 59<br />
percent from Russia. These<br />
three countries alone accounted<br />
for 7.13 million MT, or about<br />
76 percent of the overall 9.40<br />
million MT increase in steel<br />
imports in 1998 (Chart 2-13).<br />
In sharp contrast to the large<br />
import increases from Japan,<br />
Korea, <strong>and</strong> Russia, 1998<br />
imports from other major<br />
foreign steel suppliers to the<br />
United States fell or remained<br />
at roughly the same level.<br />
• Imports from the EU fell 4<br />
percent.<br />
• Imports from Mexico fell 5<br />
percent.<br />
• Imports from Canada<br />
increased slightly, up 3<br />
percent compared to 1997.<br />
As Imports Rise, Prices<br />
Tumble: Product-by-<br />
Product Review<br />
An examination of individual<br />
product categories underscores<br />
the major role that imports<br />
from Russia, Japan <strong>and</strong> Korea<br />
played in 1998. Although<br />
imports from each of these<br />
countries did not necessarily<br />
surge in every product category<br />
(e.g., Russian import increases<br />
were confined primarily to hot<strong>and</strong><br />
cold-rolled steel, while<br />
imports of Korean hot-rolled<br />
steel fell in 1998), 52 in most<br />
product categories, rising<br />
imports from one or more of<br />
these three countries were a<br />
significant factor behind the<br />
overall increase in that product<br />
category. 53<br />
The increases in imports,<br />
coupled with aggressive pricing<br />
by suppliers of Russian,<br />
Metric Tons<br />
Thous<strong>and</strong>s<br />
Metric Tons<br />
Thous<strong>and</strong>s<br />
1,200<br />
1,000<br />
800<br />
600<br />
400<br />
200<br />
0<br />
1,200<br />
1,000<br />
1996 1997 1998<br />
Source: U.S. Department of Commerce, Bureau of the Census;<br />
American Iron <strong>and</strong> <strong>Steel</strong> Institute.<br />
800<br />
600<br />
400<br />
200<br />
0<br />
2-10. U.S. Imports of Rebar<br />
1996 1997 1998<br />
Source: U.S. Department of Commerce, Bureau of the Census;<br />
American Iron <strong>and</strong> <strong>Steel</strong> Institute.<br />
2-11. U.S. Imports of Line Pipe<br />
2-12. U.S. <strong>Steel</strong> Imports: 1997–1998<br />
Product Group 1997 Imports 1998 Imports Percent Change<br />
(metric tons) (metric tons) 1997–1998<br />
Total <strong>Steel</strong> Mill Products 28,264,788 37,666,050 33<br />
Finished <strong>Steel</strong> 22,496,615 31,519,107 40<br />
Hot-rolled <strong>Steel</strong> 6,092,967 10,608,242 74<br />
Cold-rolled <strong>Steel</strong> 3,699,821 4,055,110 10<br />
Cut-to-length Plate 1,259,123 1,927,470 53<br />
Heavy <strong>Structural</strong>s 933,170 2,518,343 170<br />
Rebar 636,218 1,115,118 75<br />
Line Pipe 832,014 1,141,965 27<br />
Source: U.S. Department of Commerce, Bureau of the Census; American Iron <strong>and</strong><br />
<strong>Steel</strong> Institute.<br />
Chapter 2: The U.S. <strong>Steel</strong> Import Crisis 23