You also want an ePaper? Increase the reach of your titles
YUMPU automatically turns print PDFs into web optimized ePapers that Google loves.
<strong>Grundfos</strong> E-<strong>pumps</strong><br />
2<br />
Performance curves of speed-controlled<br />
<strong>pumps</strong><br />
Performance curves<br />
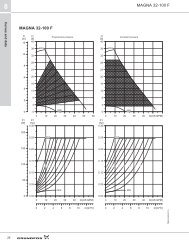
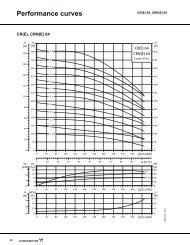
The curve chart below shows a CRE 15-3. The top part<br />
of the chart shows the QH performance curves at<br />
different speeds. Curves for speeds between 100 %<br />
and 40 % are included at 10 % intervals. Finally, a<br />
minimum curve at 25 % is shown.<br />
The bottom part of the chart shows P1 (input power<br />
from the power supply). NPSH for the pump at<br />
maximum speed is shown in the same diagram.<br />
eta [%]<br />
90%<br />
80%<br />
70%<br />
60%<br />
50%<br />
40%<br />
30%<br />
20%<br />
10%<br />
0%<br />
0<br />
100%<br />
80%<br />
60%<br />
60% 80% 100%<br />
100%<br />
80%<br />
60%<br />
1.0 2.0 3.0 4.0 5.0 6.0 Q [gpm]<br />
0 5 10 15 20 25 30 Q [m3/h]<br />
}<br />
}<br />
}<br />
η MLE<br />
η P<br />
η TOT<br />
TM05 0878 1811<br />
Product overview<br />
Fig. 9<br />
Efficiency curves for MLE, pump and complete<br />
E-pump at 100 %, 80 % and 60 % speed<br />
Fig. 7 Performance curve of a CRE 15-3<br />
Efficiency<br />
The total efficiency of the E-pump η total is calculated by<br />
multiplying the efficiency of the MLE with the pump<br />
efficiency.<br />
Fig. 8<br />
P 1 P 2<br />
MLE<br />
η MLE<br />
P 1 = input power, MLE motor<br />
P 2 = input power, pump<br />
P H = hydraulic power<br />
η pump<br />
Efficiency of an E-pump<br />
The efficiency of the MLE motor depends on the size of<br />
the motor, the speed and the load of the shaft.<br />
Firstly, the efficiency of the pump depends on the flow<br />
Q, and secondly the speed of the pump.<br />
P H<br />
TM03 0433 5104<br />
TM00 8720 4996<br />
Figure 9 shows the efficiency of the MLE and the pump<br />
part and finally the resulting efficiency of a CRE 15-3<br />
with a 4 Hp (3 kW) MLE motor. The curves are drawn<br />
as a function of flow Q and for three different speed<br />
values: 100 %, 80 % and 60 %.<br />
Assuming the situation shown in fig. 9, with a duty<br />
point at 100 % speed equal to Q = 76.6 gpm<br />
(17.4 m 3 /h) and H = 105 ft (32 m), the change in<br />
efficiency at 80 and 60 % speed is shown in the<br />
following table:<br />
Speed<br />
[%]<br />
100<br />
80<br />
60<br />
Q H P 1 P 2 P H η P η MLE η TOT<br />
[gpm<br />
(m 3 /h)]<br />
76.6<br />
(17.4)<br />
61.6<br />
(14)<br />
46.2<br />
(10.5)<br />
[ft<br />
(m)]<br />
105<br />
(32)<br />
69<br />
(21.1)<br />
39<br />
(12)<br />
[kW] [kW] [kW] [%] [%] [%]<br />
3.55<br />
(2.65)<br />
1.97<br />
(1.47)<br />
0.89<br />
(0.66)<br />
2.86<br />
(2.13)<br />
1.53<br />
(1.14)<br />
0.66<br />
(0.49)<br />
2.02<br />
(1.51)<br />
1.07<br />
(0.8)<br />
0.46<br />
(0.34)<br />
71.1 80.4 57.2<br />
70.5 77.6 54.7<br />
70.4 73.8 51.9<br />
The pump efficiency η P is reduced from 71.1 % to<br />
70.4 %, meaning less than one % point drop in<br />
efficiency.<br />
Due to the big drop in speed and shaft load, the<br />
efficiency of the MLE is reduced in the range of 7 %<br />
points resulting in an overall reduction of E-pump<br />
efficiency equal to 5.3 % points.<br />
Efficiency is important, but what counts is the power<br />
consumption as it directly influences the energy costs.<br />
As appears from the table above, the power<br />
consumption P 1 drops from 3.55 Hp to 0.89 Hp<br />
(2.65 kW to 0.66 kW) which is a 75 % reduction.<br />
The conclusion is that the speed reduction is the most<br />
important factor with regard to energy saving, and that<br />
the drop in efficiency will only have minor influence on<br />
the possible savings achieved through speed control.<br />
13