Teacher Education and Development Study in Mathematics - IEA
Teacher Education and Development Study in Mathematics - IEA
Teacher Education and Development Study in Mathematics - IEA
Create successful ePaper yourself
Turn your PDF publications into a flip-book with our unique Google optimized e-Paper software.
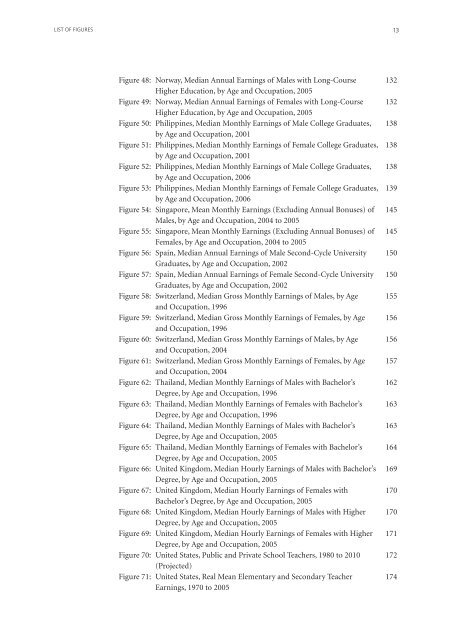
LIST OF FIGURES<br />
13<br />
Figure 48: Norway, Median Annual Earn<strong>in</strong>gs of Males with Long-Course 132<br />
Higher <strong>Education</strong>, by Age <strong>and</strong> Occupation, 2005<br />
Figure 49: Norway, Median Annual Earn<strong>in</strong>gs of Females with Long-Course 132<br />
Higher <strong>Education</strong>, by Age <strong>and</strong> Occupation, 2005<br />
Figure 50: Philipp<strong>in</strong>es, Median Monthly Earn<strong>in</strong>gs of Male College Graduates, 138<br />
by Age <strong>and</strong> Occupation, 2001<br />
Figure 51: Philipp<strong>in</strong>es, Median Monthly Earn<strong>in</strong>gs of Female College Graduates, 138<br />
by Age <strong>and</strong> Occupation, 2001<br />
Figure 52: Philipp<strong>in</strong>es, Median Monthly Earn<strong>in</strong>gs of Male College Graduates, 138<br />
by Age <strong>and</strong> Occupation, 2006<br />
Figure 53: Philipp<strong>in</strong>es, Median Monthly Earn<strong>in</strong>gs of Female College Graduates, 139<br />
by Age <strong>and</strong> Occupation, 2006<br />
Figure 54: S<strong>in</strong>gapore, Mean Monthly Earn<strong>in</strong>gs (Exclud<strong>in</strong>g Annual Bonuses) of 145<br />
Males, by Age <strong>and</strong> Occupation, 2004 to 2005<br />
Figure 55: S<strong>in</strong>gapore, Mean Monthly Earn<strong>in</strong>gs (Exclud<strong>in</strong>g Annual Bonuses) of 145<br />
Females, by Age <strong>and</strong> Occupation, 2004 to 2005<br />
Figure 56: Spa<strong>in</strong>, Median Annual Earn<strong>in</strong>gs of Male Second-Cycle University 150<br />
Graduates, by Age <strong>and</strong> Occupation, 2002<br />
Figure 57: Spa<strong>in</strong>, Median Annual Earn<strong>in</strong>gs of Female Second-Cycle University 150<br />
Graduates, by Age <strong>and</strong> Occupation, 2002<br />
Figure 58: Switzerl<strong>and</strong>, Median Gross Monthly Earn<strong>in</strong>gs of Males, by Age 155<br />
<strong>and</strong> Occupation, 1996<br />
Figure 59: Switzerl<strong>and</strong>, Median Gross Monthly Earn<strong>in</strong>gs of Females, by Age 156<br />
<strong>and</strong> Occupation, 1996<br />
Figure 60: Switzerl<strong>and</strong>, Median Gross Monthly Earn<strong>in</strong>gs of Males, by Age 156<br />
<strong>and</strong> Occupation, 2004<br />
Figure 61: Switzerl<strong>and</strong>, Median Gross Monthly Earn<strong>in</strong>gs of Females, by Age 157<br />
<strong>and</strong> Occupation, 2004<br />
Figure 62: Thail<strong>and</strong>, Median Monthly Earn<strong>in</strong>gs of Males with Bachelor’s 162<br />
Degree, by Age <strong>and</strong> Occupation, 1996<br />
Figure 63: Thail<strong>and</strong>, Median Monthly Earn<strong>in</strong>gs of Females with Bachelor’s 163<br />
Degree, by Age <strong>and</strong> Occupation, 1996<br />
Figure 64: Thail<strong>and</strong>, Median Monthly Earn<strong>in</strong>gs of Males with Bachelor’s 163<br />
Degree, by Age <strong>and</strong> Occupation, 2005<br />
Figure 65: Thail<strong>and</strong>, Median Monthly Earn<strong>in</strong>gs of Females with Bachelor’s 164<br />
Degree, by Age <strong>and</strong> Occupation, 2005<br />
Figure 66: United K<strong>in</strong>gdom, Median Hourly Earn<strong>in</strong>gs of Males with Bachelor’s 169<br />
Degree, by Age <strong>and</strong> Occupation, 2005<br />
Figure 67: United K<strong>in</strong>gdom, Median Hourly Earn<strong>in</strong>gs of Females with 170<br />
Bachelor’s Degree, by Age <strong>and</strong> Occupation, 2005<br />
Figure 68: United K<strong>in</strong>gdom, Median Hourly Earn<strong>in</strong>gs of Males with Higher 170<br />
Degree, by Age <strong>and</strong> Occupation, 2005<br />
Figure 69: United K<strong>in</strong>gdom, Median Hourly Earn<strong>in</strong>gs of Females with Higher 171<br />
Degree, by Age <strong>and</strong> Occupation, 2005<br />
Figure 70: United States, Public <strong>and</strong> Private School <strong>Teacher</strong>s, 1980 to 2010 172<br />
(Projected)<br />
Figure 71: United States, Real Mean Elementary <strong>and</strong> Secondary <strong>Teacher</strong> 174<br />
Earn<strong>in</strong>gs, 1970 to 2005


