

Teacher Education and Development Study in Mathematics - IEA
Teacher Education and Development Study in Mathematics - IEA
Teacher Education and Development Study in Mathematics - IEA

Create successful ePaper yourself
Turn your PDF publications into a flip-book with our unique Google optimized e-Paper software.
PART 1: TEACHER RELATIVE PAY AND STUDENT PERFORMANCE<br />
37<br />
<strong>and</strong> the percentage of the age cohort <strong>in</strong> lower-secondary education. The coefficient of<br />
GDP per capita changed somewhat with the <strong>in</strong>clusion of total population, but the G<strong>in</strong>i<br />
coefficient rema<strong>in</strong>ed highly robust.<br />
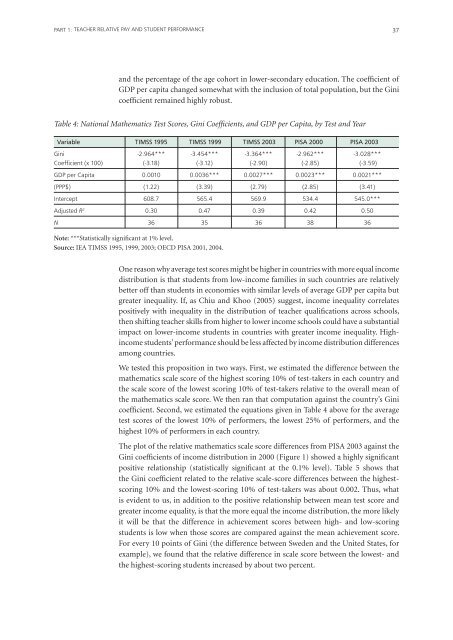
Table 4: National <strong>Mathematics</strong> Test Scores, G<strong>in</strong>i Coefficients, <strong>and</strong> GDP per Capita, by Test <strong>and</strong> Year<br />
Variable TIMSS 1995 TIMSS 1999 TIMSS 2003 PISA 2000 PISA 2003<br />
G<strong>in</strong>i -2.964*** -3.454*** -3.364*** -2.962*** -3.028***<br />
Coefficient (x 100) (-3.18) (-3.12) (-2.90) (-2.85) (-3.59)<br />
GDP per Capita 0.0010 0.0036*** 0.0027*** 0.0023*** 0.0021***<br />
(PPP$) (1.22) (3.39) (2.79) (2.85) (3.41)<br />
Intercept 608.7 565.4 569.9 534.4 545.0***<br />
Adjusted R 2 0.30 0.47 0.39 0.42 0.50<br />
N 36 35 36 38 36<br />
Note: ***Statistically significant at 1% level.<br />
Source: <strong>IEA</strong> TIMSS 1995, 1999, 2003; OECD PISA 2001, 2004.<br />
One reason why average test scores might be higher <strong>in</strong> countries with more equal <strong>in</strong>come<br />
distribution is that students from low-<strong>in</strong>come families <strong>in</strong> such countries are relatively<br />
better off than students <strong>in</strong> economies with similar levels of average GDP per capita but<br />
greater <strong>in</strong>equality. If, as Chiu <strong>and</strong> Khoo (2005) suggest, <strong>in</strong>come <strong>in</strong>equality correlates<br />
positively with <strong>in</strong>equality <strong>in</strong> the distribution of teacher qualifications across schools,<br />
then shift<strong>in</strong>g teacher skills from higher to lower <strong>in</strong>come schools could have a substantial<br />
impact on lower-<strong>in</strong>come students <strong>in</strong> countries with greater <strong>in</strong>come <strong>in</strong>equality. High<strong>in</strong>come<br />
students’ performance should be less affected by <strong>in</strong>come distribution differences<br />
among countries.<br />
We tested this proposition <strong>in</strong> two ways. First, we estimated the difference between the<br />
mathematics scale score of the highest scor<strong>in</strong>g 10% of test-takers <strong>in</strong> each country <strong>and</strong><br />
the scale score of the lowest scor<strong>in</strong>g 10% of test-takers relative to the overall mean of<br />
the mathematics scale score. We then ran that computation aga<strong>in</strong>st the country’s G<strong>in</strong>i<br />
coefficient. Second, we estimated the equations given <strong>in</strong> Table 4 above for the average<br />
test scores of the lowest 10% of performers, the lowest 25% of performers, <strong>and</strong> the<br />
highest 10% of performers <strong>in</strong> each country.<br />
The plot of the relative mathematics scale score differences from PISA 2003 aga<strong>in</strong>st the<br />
G<strong>in</strong>i coefficients of <strong>in</strong>come distribution <strong>in</strong> 2000 (Figure 1) showed a highly significant<br />
positive relationship (statistically significant at the 0.1% level). Table 5 shows that<br />
the G<strong>in</strong>i coefficient related to the relative scale-score differences between the highestscor<strong>in</strong>g<br />
10% <strong>and</strong> the lowest-scor<strong>in</strong>g 10% of test-takers was about 0.002. Thus, what<br />
is evident to us, <strong>in</strong> addition to the positive relationship between mean test score <strong>and</strong><br />
greater <strong>in</strong>come equality, is that the more equal the <strong>in</strong>come distribution, the more likely<br />
it will be that the difference <strong>in</strong> achievement scores between high- <strong>and</strong> low-scor<strong>in</strong>g<br />
students is low when those scores are compared aga<strong>in</strong>st the mean achievement score.<br />
For every 10 po<strong>in</strong>ts of G<strong>in</strong>i (the difference between Sweden <strong>and</strong> the United States, for<br />
example), we found that the relative difference <strong>in</strong> scale score between the lowest- <strong>and</strong><br />
the highest-scor<strong>in</strong>g students <strong>in</strong>creased by about two percent.


