

Teacher Education and Development Study in Mathematics - IEA
Teacher Education and Development Study in Mathematics - IEA
Teacher Education and Development Study in Mathematics - IEA

You also want an ePaper? Increase the reach of your titles
YUMPU automatically turns print PDFs into web optimized ePapers that Google loves.
70<br />
TEACHER PAY AND STUDENT MATHEMATICS ACHIEVEMENT<br />
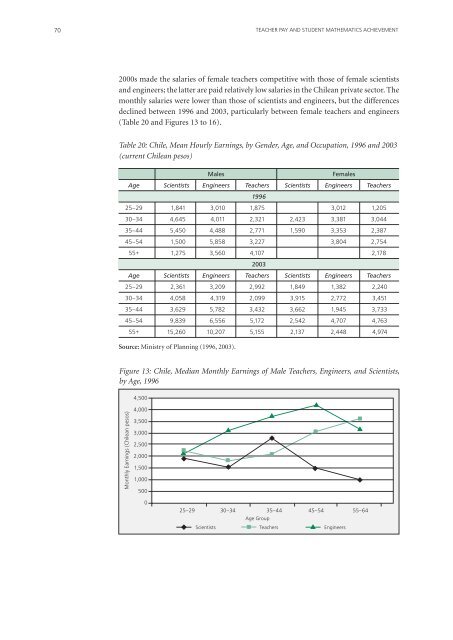
2000s made the salaries of female teachers competitive with those of female scientists<br />
<strong>and</strong> eng<strong>in</strong>eers; the latter are paid relatively low salaries <strong>in</strong> the Chilean private sector. The<br />
monthly salaries were lower than those of scientists <strong>and</strong> eng<strong>in</strong>eers, but the differences<br />
decl<strong>in</strong>ed between 1996 <strong>and</strong> 2003, particularly between female teachers <strong>and</strong> eng<strong>in</strong>eers<br />
(Table 20 <strong>and</strong> Figures 13 to 16).<br />
Table 20: Chile, Mean Hourly Earn<strong>in</strong>gs, by Gender, Age, <strong>and</strong> Occupation, 1996 <strong>and</strong> 2003<br />
(current Chilean pesos)<br />
Males<br />
Females<br />
Age Scientists Eng<strong>in</strong>eers <strong>Teacher</strong>s Scientists Eng<strong>in</strong>eers <strong>Teacher</strong>s<br />
1996<br />
25–29 1,841 3,010 1,875 3,012 1,205<br />
30–34 4,645 4,011 2,321 2,423 3,381 3,044<br />
35–44 5,450 4,488 2,771 1,590 3,353 2,387<br />
45–54 1,500 5,858 3,227 3,804 2,754<br />
55+ 1,275 3,560 4,107 2,178<br />
2003<br />
Age Scientists Eng<strong>in</strong>eers <strong>Teacher</strong>s Scientists Eng<strong>in</strong>eers <strong>Teacher</strong>s<br />
25–29 2,361 3,209 2,992 1,849 1,382 2,240<br />
30–34 4,058 4,319 2,099 3,915 2,772 3,451<br />
35–44 3,629 5,782 3,432 3,662 1,945 3,733<br />
45–54 9,839 6,556 5,172 2,542 4,707 4,763<br />
55+ 15,260 10,207 5,155 2,137 2,448 4,974<br />
Source: M<strong>in</strong>istry of Plann<strong>in</strong>g (1996, 2003).<br />
Figure 13: Chile, Median Monthly Earn<strong>in</strong>gs of Male <strong>Teacher</strong>s, Eng<strong>in</strong>eers, <strong>and</strong> Scientists,<br />
by Age, 1996<br />
4,500<br />
Monthly Earn<strong>in</strong>gs (Chilean pesos)<br />
4,000<br />
3,500<br />
3,000<br />
2,500<br />
2,000<br />
1,500<br />
1,000<br />
500<br />
0<br />
25–29<br />
Scientists<br />
30–34<br />
35–44 45–54<br />
55–64<br />
Age Group<br />
<strong>Teacher</strong>s<br />
Eng<strong>in</strong>eers


