

Teacher Education and Development Study in Mathematics - IEA
Teacher Education and Development Study in Mathematics - IEA
Teacher Education and Development Study in Mathematics - IEA

Create successful ePaper yourself
Turn your PDF publications into a flip-book with our unique Google optimized e-Paper software.
PART 1: TEACHER RELATIVE PAY AND STUDENT PERFORMANCE<br />
43<br />
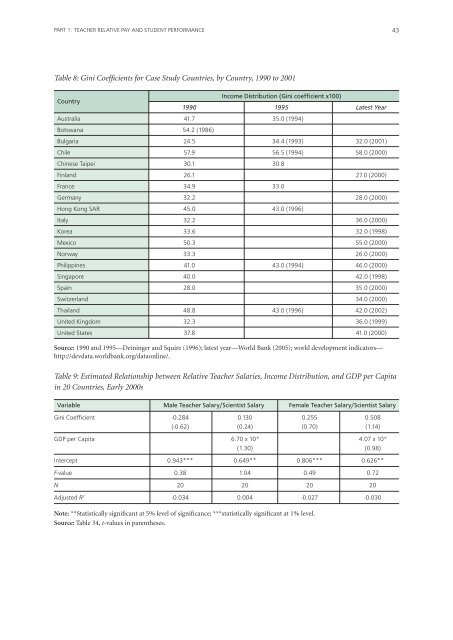
Table 8: G<strong>in</strong>i Coefficients for Case <strong>Study</strong> Countries, by Country, 1990 to 2001<br />
Country<br />
Income Distribution (G<strong>in</strong>i coefficient x100)<br />
1990 1995 Latest Year<br />
Australia 41.7 35.0 (1994)<br />
Botswana 54.2 (1986)<br />
Bulgaria 24.5 34.4 (1993) 32.0 (2001)<br />
Chile 57.9 56.5 (1994) 58.0 (2000)<br />
Ch<strong>in</strong>ese Taipei 30.1 30.8<br />
F<strong>in</strong>l<strong>and</strong> 26.1 27.0 (2000)<br />
France 34.9 33.0<br />
Germany 32.2 28.0 (2000)<br />
Hong Kong SAR 45.0 43.0 (1996)<br />
Italy 32.2 36.0 (2000)<br />
Korea 33.6 32.0 (1998)<br />
Mexico 50.3 55.0 (2000)<br />
Norway 33.3 26.0 (2000)<br />
Philipp<strong>in</strong>es 41.0 43.0 (1994) 46.0 (2000)<br />
S<strong>in</strong>gapore 40.0 42.0 (1998)<br />
Spa<strong>in</strong> 28.0 35.0 (2000)<br />
Switzerl<strong>and</strong> 34.0 (2000)<br />
Thail<strong>and</strong> 48.8 43.0 (1996) 42.0 (2002)<br />
United K<strong>in</strong>gdom 32.3 36.0 (1999)<br />
United States 37.8 41.0 (2000)<br />
Source: 1990 <strong>and</strong> 1995—De<strong>in</strong><strong>in</strong>ger <strong>and</strong> Squire (1996); latest year—World Bank (2005); world development <strong>in</strong>dicators—<br />
http://devdata.worldbank.org/dataonl<strong>in</strong>e/.<br />
Table 9: Estimated Relationship between Relative <strong>Teacher</strong> Salaries, Income Distribution, <strong>and</strong> GDP per Capita<br />
<strong>in</strong> 20 Countries, Early 2000s<br />
Variable Male <strong>Teacher</strong> Salary/Scientist Salary Female <strong>Teacher</strong> Salary/Scientist Salary<br />
G<strong>in</strong>i Coefficient -0.284 0.130 0.255 0.508<br />
(-0.62) (0.24) (0.70) (1.14)<br />
GDP per Capita 6.70 x 10 -6 4.07 x 10 -6<br />
(1.30) (0.98)<br />
Intercept 0.943*** 0.649** 0.806*** 0.626**<br />
F-value 0.38 1.04 0.49 0.72<br />
N 20 20 20 20<br />
Adjusted R 2 -0.034 0.004 -0.027 -0.030<br />
Note: **Statistically significant at 5% level of significance; ***statistically significant at 1% level.<br />
Source: Table 34, t-values <strong>in</strong> parentheses.


