

Teacher Education and Development Study in Mathematics - IEA
Teacher Education and Development Study in Mathematics - IEA
Teacher Education and Development Study in Mathematics - IEA

Create successful ePaper yourself
Turn your PDF publications into a flip-book with our unique Google optimized e-Paper software.
PART 1: TEACHER RELATIVE PAY AND STUDENT PERFORMANCE<br />
45<br />
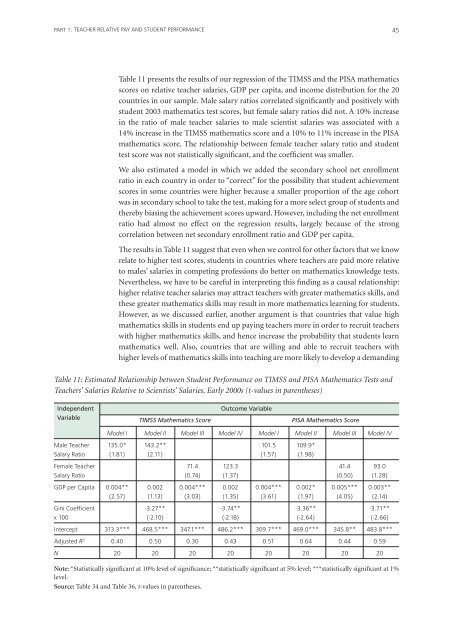
Table 11 presents the results of our regression of the TIMSS <strong>and</strong> the PISA mathematics<br />
scores on relative teacher salaries, GDP per capita, <strong>and</strong> <strong>in</strong>come distribution for the 20<br />
countries <strong>in</strong> our sample. Male salary ratios correlated significantly <strong>and</strong> positively with<br />
student 2003 mathematics test scores, but female salary ratios did not. A 10% <strong>in</strong>crease<br />
<strong>in</strong> the ratio of male teacher salaries to male scientist salaries was associated with a<br />
14% <strong>in</strong>crease <strong>in</strong> the TIMSS mathematics score <strong>and</strong> a 10% to 11% <strong>in</strong>crease <strong>in</strong> the PISA<br />
mathematics score. The relationship between female teacher salary ratio <strong>and</strong> student<br />
test score was not statistically significant, <strong>and</strong> the coefficient was smaller.<br />
We also estimated a model <strong>in</strong> which we added the secondary school net enrollment<br />
ratio <strong>in</strong> each country <strong>in</strong> order to “correct” for the possibility that student achievement<br />
scores <strong>in</strong> some countries were higher because a smaller proportion of the age cohort<br />
was <strong>in</strong> secondary school to take the test, mak<strong>in</strong>g for a more select group of students <strong>and</strong><br />
thereby bias<strong>in</strong>g the achievement scores upward. However, <strong>in</strong>clud<strong>in</strong>g the net enrollment<br />
ratio had almost no effect on the regression results, largely because of the strong<br />
correlation between net secondary enrollment ratio <strong>and</strong> GDP per capita.<br />
The results <strong>in</strong> Table 11 suggest that even when we control for other factors that we know<br />
relate to higher test scores, students <strong>in</strong> countries where teachers are paid more relative<br />
to males’ salaries <strong>in</strong> compet<strong>in</strong>g professions do better on mathematics knowledge tests.<br />
Nevertheless, we have to be careful <strong>in</strong> <strong>in</strong>terpret<strong>in</strong>g this f<strong>in</strong>d<strong>in</strong>g as a causal relationship:<br />
higher relative teacher salaries may attract teachers with greater mathematics skills, <strong>and</strong><br />
these greater mathematics skills may result <strong>in</strong> more mathematics learn<strong>in</strong>g for students.<br />
However, as we discussed earlier, another argument is that countries that value high<br />
mathematics skills <strong>in</strong> students end up pay<strong>in</strong>g teachers more <strong>in</strong> order to recruit teachers<br />
with higher mathematics skills, <strong>and</strong> hence <strong>in</strong>crease the probability that students learn<br />
mathematics well. Also, countries that are will<strong>in</strong>g <strong>and</strong> able to recruit teachers with<br />
higher levels of mathematics skills <strong>in</strong>to teach<strong>in</strong>g are more likely to develop a dem<strong>and</strong><strong>in</strong>g<br />
Table 11: Estimated Relationship between Student Performance on TIMSS <strong>and</strong> PISA <strong>Mathematics</strong> Tests <strong>and</strong><br />
<strong>Teacher</strong>s’ Salaries Relative to Scientists’ Salaries, Early 2000s (t-values <strong>in</strong> parentheses)<br />
Independent<br />
Variable<br />
TIMSS <strong>Mathematics</strong> Score<br />
Outcome Variable<br />
PISA <strong>Mathematics</strong> Score<br />
Model I Model II Model III Model IV Model I Model II Model III Model IV<br />
Male <strong>Teacher</strong> 135.0* 143.2** 101.5 109.9*<br />
Salary Ratio (1.81) (2.11) (1.57) (1.98)<br />
Female <strong>Teacher</strong> 71.4 123.3 41.4 93.0<br />
Salary Ratio (0.74) (1.37) (0.50) (1.28)<br />
GDP per Capita 0.004** 0.002 0.004*** 0.002 0.004*** 0.002* 0.005*** 0.003**<br />
(2.57) (1.13) (3.03) (1.35) (3.61) (1.97) (4.05) (2.14)<br />
G<strong>in</strong>i Coefficient -3.27** -3.74** -3.36** -3.71**<br />
x 100 (-2.10) (-2.18) (-2.64) (-2.66)<br />
Intercept 313.3*** 468.5*** 347.1*** 486.2*** 309.7*** 469.0*** 345.8** 483.8***<br />
Adjusted R 2 0.40 0.50 0.30 0.43 0.51 0.64 0.44 0.59<br />
N 20 20 20 20 20 20 20 20<br />
Note: *Statistically significant at 10% level of significance; **statistically significant at 5% level; ***statistically significant at 1%<br />
level.<br />
Source: Table 34 <strong>and</strong> Table 36, t-values <strong>in</strong> parentheses.


