

Teacher Education and Development Study in Mathematics - IEA
Teacher Education and Development Study in Mathematics - IEA
Teacher Education and Development Study in Mathematics - IEA

Create successful ePaper yourself
Turn your PDF publications into a flip-book with our unique Google optimized e-Paper software.
PART 1: TEACHER RELATIVE PAY AND STUDENT PERFORMANCE<br />
39<br />
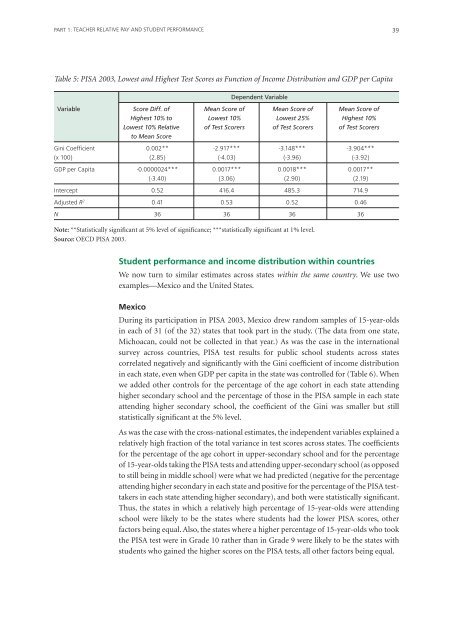
Table 5: PISA 2003, Lowest <strong>and</strong> Highest Test Scores as Function of Income Distribution <strong>and</strong> GDP per Capita<br />
Dependent Variable<br />
Variable Score Diff. of Mean Score of Mean Score of Mean Score of<br />
Highest 10% to Lowest 10% Lowest 25% Highest 10%<br />
Lowest 10% Relative of Test Scorers of Test Scorers of Test Scorers<br />
to Mean Score<br />
G<strong>in</strong>i Coefficient 0.002** -2.917*** -3.148*** -3.904***<br />
(x 100) (2.85) (-4.03) (-3.96) (-3.92)<br />
GDP per Capita -0.0000024*** 0.0017*** 0.0018*** 0.0017**<br />
(-3.40) (3.06) (2.90) (2.19)<br />
Intercept 0.52 416.4 485.3 714.9<br />
Adjusted R 2 0.41 0.53 0.52 0.46<br />
N 36 36 36 36<br />
Note: **Statistically significant at 5% level of significance; ***statistically significant at 1% level.<br />
Source: OECD PISA 2003.<br />
Student performance <strong>and</strong> <strong>in</strong>come distribution with<strong>in</strong> countries<br />
We now turn to similar estimates across states with<strong>in</strong> the same country. We use two<br />
examples—Mexico <strong>and</strong> the United States.<br />
Mexico<br />
Dur<strong>in</strong>g its participation <strong>in</strong> PISA 2003, Mexico drew r<strong>and</strong>om samples of 15-year-olds<br />
<strong>in</strong> each of 31 (of the 32) states that took part <strong>in</strong> the study. (The data from one state,<br />
Michoacan, could not be collected <strong>in</strong> that year.) As was the case <strong>in</strong> the <strong>in</strong>ternational<br />
survey across countries, PISA test results for public school students across states<br />
correlated negatively <strong>and</strong> significantly with the G<strong>in</strong>i coefficient of <strong>in</strong>come distribution<br />
<strong>in</strong> each state, even when GDP per capita <strong>in</strong> the state was controlled for (Table 6). When<br />
we added other controls for the percentage of the age cohort <strong>in</strong> each state attend<strong>in</strong>g<br />
higher secondary school <strong>and</strong> the percentage of those <strong>in</strong> the PISA sample <strong>in</strong> each state<br />
attend<strong>in</strong>g higher secondary school, the coefficient of the G<strong>in</strong>i was smaller but still<br />
statistically significant at the 5% level.<br />
As was the case with the cross-national estimates, the <strong>in</strong>dependent variables expla<strong>in</strong>ed a<br />
relatively high fraction of the total variance <strong>in</strong> test scores across states. The coefficients<br />
for the percentage of the age cohort <strong>in</strong> upper-secondary school <strong>and</strong> for the percentage<br />
of 15-year-olds tak<strong>in</strong>g the PISA tests <strong>and</strong> attend<strong>in</strong>g upper-secondary school (as opposed<br />
to still be<strong>in</strong>g <strong>in</strong> middle school) were what we had predicted (negative for the percentage<br />
attend<strong>in</strong>g higher secondary <strong>in</strong> each state <strong>and</strong> positive for the percentage of the PISA testtakers<br />
<strong>in</strong> each state attend<strong>in</strong>g higher secondary), <strong>and</strong> both were statistically significant.<br />
Thus, the states <strong>in</strong> which a relatively high percentage of 15-year-olds were attend<strong>in</strong>g<br />
school were likely to be the states where students had the lower PISA scores, other<br />
factors be<strong>in</strong>g equal. Also, the states where a higher percentage of 15-year-olds who took<br />
the PISA test were <strong>in</strong> Grade 10 rather than <strong>in</strong> Grade 9 were likely to be the states with<br />
students who ga<strong>in</strong>ed the higher scores on the PISA tests, all other factors be<strong>in</strong>g equal.


