- Page 1 and 2: SATII PHYSICS (FROM SPARKNOTES.COM)
- Page 3 and 4: The Good • Because SAT II Subject
- Page 5 and 6: Which SAT II Subject Tests to Take
- Page 7 and 8: After grumbling, however, you still
- Page 9 and 10: Waves 15-19% 11-15 Waves 10% 7-8 Op
- Page 11 and 12: negative, so E, and not A, is the c
- Page 13 and 14: including them anyway because it’
- Page 15 and 16: Two positively charged particles, o
- Page 17 and 18: will a visual representation reliev
- Page 19 and 20: Physics Hint 6: Be Flexible Knowing
- Page 21 and 22: There are a number of ways to label
- Page 23 and 24: Adding Parallel Vectors If the vect
- Page 25 and 26: The result of multiplying A by c is
- Page 27 and 28: neither parallel nor perpendicular.
- Page 29 and 30: Suppose the hands on a clock are ve
- Page 31 and 32: Vector Addition Practice Questions
- Page 33 and 34: 2. A The vector 2A has a magnitude
- Page 35 and 36: path, Alan has traveled a much grea
- Page 37 and 38: school student called Andrea. Andre
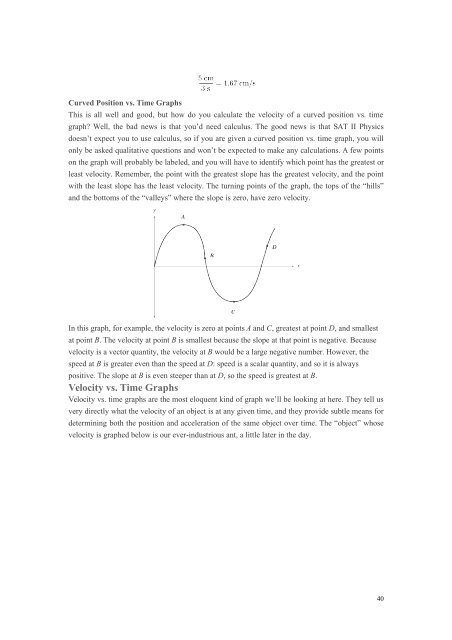
- Page 39: centimeters to the left of its star
- Page 43 and 44: Acceleration vs. Time Graphs After
- Page 45 and 46: The variable represents the object
- Page 47 and 48: Note that there are certain conveni
- Page 49 and 50: 1. . An athlete runs four laps of a
- Page 51 and 52: 10. . A woman runs 40 m to the nort
- Page 53 and 54: We know the total distance the spri
- Page 55 and 56: Principles of Natural Philosophy. I
- Page 57 and 58: The component form of Newton’s Se
- Page 59 and 60: e in the direction. And since the s
- Page 61 and 62: which reflects its resistance to be
- Page 63 and 64: In the diagram above, the weight an
- Page 65 and 66: A student pushes a box that weighs
- Page 67 and 68: 1. . Each of the figures below show
- Page 69 and 70: 7. . In the figure above, a person
- Page 71 and 72: Since the block is motionless, the
- Page 73 and 74: When we are told that a person push
- Page 75 and 76: EXAMPLE A water balloon of mass m i
- Page 77 and 78: The graph above plots the force exe
- Page 79 and 80: Though energy is always measured in
- Page 81 and 82: there is a negative amount of work
- Page 83 and 84: smallest. The answer to question 3
- Page 85 and 86: Mechanical Energy Average Power Ins
- Page 87 and 88: to a height of 8 m over a time of 4
- Page 89 and 90: 8. C When the book reaches the pers
- Page 91 and 92:
determining what those right number
- Page 93 and 94:
the ground. The system is initially
- Page 95 and 96:
calculators, you almost certainly w
- Page 97 and 98:
and minimize M.” With such a ques
- Page 99 and 100:
2. WHAT IS THE ACCELERATION OF THE
- Page 101 and 102:
Adding these two equations together
- Page 103 and 104:
force of friction: . Using Newton
- Page 105 and 106:
m, placed on a frictionless surface
- Page 107 and 108:
Frequency is given in units of cycl
- Page 109 and 110:
of the spring due to the gravitatio
- Page 111 and 112:
The oscillation of a pendulum is mu
- Page 113 and 114:
Velocity Calculating the velocity o
- Page 115 and 116:
Practice Questions 1. . Two masses,
- Page 117 and 118:
7. . An object of mass 3 kg is atta
- Page 119 and 120:
Since the system is in equilibrium,
- Page 121 and 122:
velocity, v. Linear momentum is den
- Page 123 and 124:
Conservation of Momentum If we comb
- Page 125 and 126:
As we might expect, the final veloc
- Page 127 and 128:
A pool player hits the eight ball,
- Page 129 and 130:
two-dimensional collision is effect
- Page 131 and 132:
For a System of Two Particles For a
- Page 133 and 134:
At the front end of the boat, the f
- Page 135 and 136:
4. . A scattering experiment is don
- Page 137 and 138:
1. B The athlete imparts a certain
- Page 139 and 140:
7. E Momentum is conserved in this
- Page 141 and 142:
The diver’s translational motion
- Page 143 and 144:
30 π/6 45 π/4 60 π/3 90 π/2 180
- Page 145 and 146:
elative position to one another. As
- Page 147 and 148:
acceleration given its angular velo
- Page 149 and 150:
To find the direction of a rigid bo
- Page 151 and 152:
A student exerts a force of 50 N on
- Page 153 and 154:
The torque that produces the angula
- Page 155 and 156:
The masses in the figure above are
- Page 157 and 158:
an object sliding down a frictionle
- Page 159 and 160:
Velocity Average Angular Accelerati
- Page 161 and 162:
3. . What is the direction of the a
- Page 163 and 164:
1. D An object that experiences 120
- Page 165 and 166:
At the top of the incline, the disk
- Page 167 and 168:
from a Latin word meaning “center
- Page 169 and 170:
Newton’s Law of Universal Gravita
- Page 171 and 172:
when you are beneath the surface of
- Page 173 and 174:
EXAMPLE A satellite of mass is laun
- Page 175 and 176:
Kepler’s Laws After poring over t
- Page 177 and 178:
Practice Questions Questions 1-3 re
- Page 179 and 180:
8. . A satellite orbits the Earth a
- Page 181 and 182:
Circumference and radius are relate
- Page 183 and 184:
learn how heat is transferred from
- Page 185 and 186:
heat, like rubber, have a high spec
- Page 187 and 188:
Just as specific heat tells us how
- Page 189 and 190:
Conduction is the transfer of heat
- Page 191 and 192:
Effectively, this equation tells us
- Page 193 and 194:
the way that it does. The Laws of T
- Page 195 and 196:
There are a number of equivalent fo
- Page 197 and 198:
If we know our formulas, this probl
- Page 199 and 200:
5. . An ideal gas is enclosed in a
- Page 201 and 202:
Asphalt, like most materials, has a
- Page 203 and 204:
The things we call atoms today are
- Page 205 and 206:
If they come up on SAT II Physics,
- Page 207 and 208:
will move in the opposite direction
- Page 209 and 210:
Work The work done to move a charge
- Page 211 and 212:
Much like gravitational potential e
- Page 213 and 214:
3. . A particle of charge +2q exert
- Page 215 and 216:
7. . A particle of charge +q is a d
- Page 217 and 218:
The vector sum of the three vectors
- Page 219 and 220:
Voltage The batteries we use in fla
- Page 221 and 222:
This equation tells us that we can
- Page 223 and 224:
If the two variables you know are a
- Page 225 and 226:
However, each resistor causes a vol
- Page 227 and 228:
So = 4 . WHAT IS THE CURRENT RUNNIN
- Page 229 and 230:
Consider again the circuit whose to
- Page 231 and 232:
This circuit consists of resistors
- Page 233 and 234:
The junction rule deals with “jun
- Page 235 and 236:
across the loop. We can express the
- Page 237 and 238:
capacitance is halved. The proporti
- Page 239 and 240:
The Greek letter is called the diel
- Page 241 and 242:
4. . Two resistors, and , are ident
- Page 243 and 244:
10. . A dielectric is inserted into
- Page 245 and 246:
The equivalent capacitance of two c
- Page 247 and 248:
The Earth itself acts like a huge b
- Page 249 and 250:
Because the velocity vector and the
- Page 251 and 252:
A particle with a positive charge o
- Page 253 and 254:
The constant is called the permeabi
- Page 255 and 256:
1. . The pointer on a compass is th
- Page 257 and 258:
7. . A positively charged particle
- Page 259 and 260:
1. B To solve this problem, it is h
- Page 261 and 262:
If the particle is to move at a con
- Page 263 and 264:
flowing in the counterclockwise dir
- Page 265 and 266:
Next, let’s calculate the flux th
- Page 267 and 268:
Remember that field lines come out
- Page 269 and 270:
Magnetic Flux Faraday’s Law / Len
- Page 271 and 272:
5. . A wire carrying 5.0 V is appli
- Page 273 and 274:
In this equation, A is the amplitud
- Page 275 and 276:
Ernst attaches a stretched string t
- Page 277 and 278:
A string is tied to a pole at one e
- Page 279 and 280:
other. The principle of superpositi
- Page 281 and 282:
Nodes The crests and troughs of a s
- Page 283 and 284:
The Doppler Effect So far we have o
- Page 285 and 286:
Practice Questions 1. . Which of th
- Page 287 and 288:
6. . Two pulses travel along a stri
- Page 289 and 290:
1. B Simple harmonic motion is defi
- Page 291 and 292:
where and are the frequency heard b
- Page 293 and 294:
A higher frequency—and thus a sho
- Page 295 and 296:
The phenomenon of refraction result
- Page 297 and 298:
Since we know that the ratio of / i
- Page 299 and 300:
The four basic kinds of optical ins
- Page 301 and 302:
You can test all this yourself with
- Page 303 and 304:
Because is a positive number, we kn
- Page 305 and 306:
As the diagram shows us, and as the
- Page 307 and 308:
At any point P on the back screen,
- Page 309 and 310:
Note that the pattern is brightest
- Page 311 and 312:
One of the more common ways of test
- Page 313 and 314:
3. . When the orange light passes f
- Page 315 and 316:
9. . Sound waves do not exhibit pol
- Page 317 and 318:
7. E Only concave mirrors and conve
- Page 319 and 320:
For people who believed that light
- Page 321 and 322:
What does this all mean? Time is re
- Page 323 and 324:
A spaceship flying toward the Earth
- Page 325 and 326:
Rutherford’s Gold Foil Experiment
- Page 327 and 328:
The Wave Theory of Electromagnetic
- Page 329 and 330:
The Problem with Rutherford’s Mod
- Page 331 and 332:
Don’t worry: you don’t need to
- Page 333 and 334:
A hydrogen atom is energized so tha
- Page 335 and 336:
where is the uncertainty in a parti
- Page 337 and 338:
electrons have mass, it is so negli
- Page 339 and 340:
chapters on mechanics are the resul
- Page 341 and 342:
You won’t need to calculate the n
- Page 343 and 344:
Photoelectro n Radius of Electron O
- Page 345 and 346:
5. . An electron is accelerated thr
- Page 347 and 348:
according to the formula , where l
- Page 349 and 350:
In radioactive substances, the numb
- Page 351 and 352:
A scale for measuring temperature,
- Page 353 and 354:
The points of maximum displacement
- Page 355 and 356:
Electromagnetic spectrum The spectr
- Page 357 and 358:
The amount of time it takes for one
- Page 359 and 360:
Given the period, T, and semimajor
- Page 361 and 362:
The substance that is displaced as
- Page 363 and 364:
A back-and-forth movement about an
- Page 365 and 366:
Refracted ray Refraction Restoring
- Page 367 and 368:
T Tail Tangent A body or set of bod
- Page 369 and 370:
Weber Weight The force involved in
- Page 371 and 372:
pinpointing what you need to study
- Page 373:
If you got a question wrong because