- Page 2 and 3: The information in this publication
- Page 4 and 5: Peak area tool.....................
- Page 6 and 7: Checking spectrometer performance a
- Page 8 and 9: Process............................
- Page 10 and 11: Selecting, editing or creating a re
- Page 12 and 13: How to use this manual This manual
- Page 14 and 15: • If you do not have the DS optio
- Page 16 and 17: Note If you have the DS option, you
- Page 18 and 19: Digital signature information in a
- Page 20 and 21: There are several ways to enter the
- Page 22 and 23: Note Some tutorials are available o
- Page 24 and 25: Note If you are using Windows 2000
- Page 26 and 27: Panes A pane is an area of the spec
- Page 28 and 29: Displaying a list of spectrum title
- Page 30 and 31: Displaying a different spectral reg
- Page 32 and 33: Copying information to the Clipboar
- Page 34 and 35: Note You can select all the display
- Page 36 and 37: Next, hold down the Shift key and c
- Page 38 and 39: Region tool Some OMNIC commands can
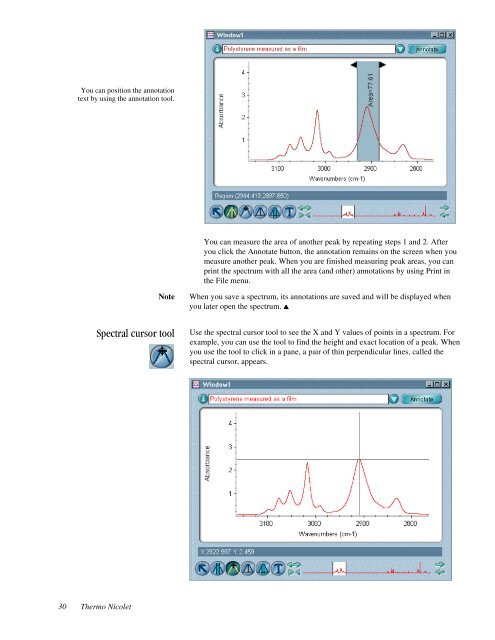
- Page 42 and 43: You can position the annotation by
- Page 44 and 45: 2. Click the Annotate button to the
- Page 46 and 47: The corrected area is bordered by t
- Page 48 and 49: 2. Edit the label text if desired.
- Page 50 and 51: Overlaying spectra lets you see sig
- Page 52 and 53: When you hide a stacked spectrum, a
- Page 54 and 55: If a pane containing a spectrum is
- Page 56 and 57: 46 Thermo Nicolet
- Page 58 and 59: File Type Extension Comments Spectr
- Page 60 and 61: The settings available in the Y Uni
- Page 62 and 63: If Put Opened Spectrum In New Windo
- Page 64 and 65: 3. If the Save As dialog box appear
- Page 66 and 67: 2. Choose Save Group from the File
- Page 68 and 69: 2. Locate and select the desired fi
- Page 70 and 71: Save a configuration This procedure
- Page 72 and 73: A dialog box appears. 2. Type a use
- Page 74 and 75: Note The Enable OMNIC Log-In comman
- Page 76 and 77: Note If a spectrum has been pasted
- Page 78 and 79: Delete files 1. Choose Delete Files
- Page 80 and 81: When you cut a displayed stacked sp
- Page 82 and 83: Pasting duplicate images of spectra
- Page 84 and 85: Note The options you set using Opti
- Page 86 and 87: File Type Initial Spectra Initial E
- Page 88 and 89: Normalize the spectra of standards
- Page 90 and 91:
In the upper-left corner of the dia
- Page 92 and 93:
Type Annotation Axis Labels Axis Nu
- Page 94 and 95:
Specifying how to print axes The op
- Page 96 and 97:
Text Type Annotation Axis Labels Ax
- Page 98 and 99:
Note If you have turned off Prompt
- Page 100 and 101:
Setting Smart Purge The Smart Purge
- Page 102 and 103:
Specifying how to list peaks found
- Page 104 and 105:
4. Collect a sample spectrum with n
- Page 106 and 107:
To specify or do this... The X-axis
- Page 108 and 109:
Turn on Display All Annotation if y
- Page 110 and 111:
Item Company Name Spectrum Title Da
- Page 112 and 113:
Preventing the overwriting of files
- Page 114 and 115:
State Enabled Disabled Hidden Descr
- Page 116 and 117:
6. If you disabled or hid the Save
- Page 118 and 119:
5. Specify the size of the toolbar
- Page 120 and 121:
Note You can create an image for a
- Page 122 and 123:
The experiment you select also sets
- Page 124 and 125:
Note The experiment you select also
- Page 126 and 127:
Note If you are studying samples th
- Page 128 and 129:
When deciding whether to use this f
- Page 130 and 131:
Titling the experiment Bench featur
- Page 132 and 133:
The peak-to-peak intensity is the s
- Page 134 and 135:
• It helps prevent infrared energ
- Page 136 and 137:
Specifying the beamsplitter type If
- Page 138 and 139:
The parameter checks appear when yo
- Page 140 and 141:
The individual checks are described
- Page 142 and 143:
Fringes result when back reflection
- Page 144 and 145:
A beamsplitter, detector, source or
- Page 146 and 147:
Type the desired minimum peak-to-pe
- Page 148 and 149:
Setting Boxcar N-B* Weak N-B* Mediu
- Page 150 and 151:
As an example, for a standard DTGS
- Page 152 and 153:
If you have installed a Smart Acces
- Page 154 and 155:
• Install a 32-bit version of OMN
- Page 156 and 157:
• To save the settings in the cur
- Page 158 and 159:
The positive settings move your vie
- Page 160 and 161:
What happens during collection? The
- Page 162 and 163:
3. Choose Collect Sample from the C
- Page 164 and 165:
Note To store the spectrum on the h
- Page 166 and 167:
Viewing the age of the background D
- Page 168 and 169:
If Preview Data Collection is turne
- Page 170 and 171:
If at any time the system condition
- Page 172 and 173:
Undo a display limit change Choose
- Page 174 and 175:
To specify this or do this... The n
- Page 176 and 177:
To remove the grid from a spectral
- Page 178 and 179:
Note You can display annotations ve
- Page 180 and 181:
This format is suitable for high re
- Page 182 and 183:
Specifying the sampling information
- Page 184 and 185:
Stacked spectra Stacking spectra is
- Page 186 and 187:
Full Scale brings the highest data
- Page 188 and 189:
Match the Y-axis scale of a spectru
- Page 190 and 191:
Display spectra vertically offset 1
- Page 192 and 193:
Display spectra full scale automati
- Page 194 and 195:
Displaying and using a toolbar Use
- Page 196 and 197:
Converting spectra to absorbance Us
- Page 198 and 199:
The units are described in the next
- Page 200 and 201:
The photoacoustic value (PAS) at a
- Page 202 and 203:
Micrometers Select Micrometers to c
- Page 204 and 205:
4. Choose OK. • If you selected K
- Page 206 and 207:
• To change the final format. You
- Page 208 and 209:
What is a baseline? A baseline cons
- Page 210 and 211:
Important Be careful not to introdu
- Page 212 and 213:
The X and Y values of the point app
- Page 214 and 215:
8. When you are finished correcting
- Page 216 and 217:
Before searching an ATR spectrum ag
- Page 218 and 219:
• A spectrum includes the region
- Page 220 and 221:
Replacing a spectral region with a
- Page 222 and 223:
Subtracting spectra Use Subtract in
- Page 224 and 225:
2. Choose Subtract from the Process
- Page 226 and 227:
Subtracting a component or contamin
- Page 228 and 229:
Note If negative peaks appear in th
- Page 230 and 231:
3. Select the desired number of smo
- Page 232 and 233:
Converting spectra to their first o
- Page 234 and 235:
Multiplying a spectrum by a number
- Page 236 and 237:
Symbol Meaning Examples / Divide. A
- Page 238 and 239:
• To change the factor using the
- Page 240 and 241:
Here is the normalized spectrum: In
- Page 242 and 243:
Normalize the scale of spectra 1. S
- Page 244 and 245:
Example libraries The following sec
- Page 246 and 247:
Click the Print button in the Find
- Page 248 and 249:
6. To display or remove the Y-axis
- Page 250 and 251:
3. Choose Average from the Process
- Page 252 and 253:
Range of Y values versus X value Pe
- Page 254 and 255:
4. If you are not using the search
- Page 256 and 257:
Using extended search The Extended
- Page 258 and 259:
When you perform the search, the ex
- Page 260 and 261:
All the QC libraries and library gr
- Page 262 and 263:
Set up a spectral search (The proce
- Page 264 and 265:
7. Specify the number of found libr
- Page 266 and 267:
5. Specify the spectral regions to
- Page 268 and 269:
Search a spectral library 1. Use Li
- Page 270 and 271:
If you did not use the search exper
- Page 272 and 273:
To print the search expert’s comm
- Page 274 and 275:
Color-coded titles of the spectrum
- Page 276 and 277:
To print the spectrum and functiona
- Page 278 and 279:
You can choose Overlay Spectra from
- Page 280 and 281:
Working with libraries Click the Li
- Page 282 and 283:
Once a library is created, you can
- Page 284 and 285:
3. Click the name of the user libra
- Page 286 and 287:
A copy of the spectrum is placed in
- Page 288 and 289:
• If you are adding more than one
- Page 290 and 291:
3. Click the name of the library. T
- Page 292 and 293:
9. Choose Search. The search result
- Page 294 and 295:
The kinds of information displayed
- Page 296 and 297:
2. Click the Create/Edit Structures
- Page 298 and 299:
If you want to print the informatio
- Page 300 and 301:
When you are ready to start printin
- Page 302 and 303:
You can only add the spectrum to a
- Page 304 and 305:
3. If you want to reset the data co
- Page 306 and 307:
Follow these general steps to creat
- Page 308 and 309:
Type Spectrum Comments Spectrum Cus
- Page 310 and 311:
3. Specify the item type by selecti
- Page 312 and 313:
5. Choose Preview/Print Report from
- Page 314 and 315:
4. If the item type is Spectral Win
- Page 316 and 317:
The page number of the currently di
- Page 318 and 319:
7. Close the Report Template window
- Page 320 and 321:
Adding a report to a notebook Use A
- Page 322 and 323:
To view a report notebook, use View
- Page 324 and 325:
Searching for text Click the Search
- Page 326 and 327:
Express dates on this tab in the fo
- Page 328 and 329:
5. To search for reports that conta
- Page 330 and 331:
Note When windows are tiled, they m
- Page 332 and 333:
atmospheric effects suppressing, 94
- Page 334 and 335:
status of, 148 time for, 115, 116,
- Page 336 and 337:
detector interface kit, 123 detecto
- Page 338 and 339:
finding peaks, 235 fingerprint regi
- Page 340 and 341:
special criteria for, 246 spectral
- Page 342 and 343:
OMNIC Atlµs default directory, 76
- Page 344 and 345:
Process options, 90 Protégé spect
- Page 346 and 347:
experiment, 114, 146 default direct
- Page 348 and 349:
detector, 127 filter for, 139 for c
- Page 350 and 351:
displaying, 14, 20, 39, 95 color fo
- Page 352 and 353:
text adding to report template, 297
- Page 354:
x X-axis, 14, 17 display limits, 17