Promoting Resource Efficiency in Small & Medium size ... - UNEP
Promoting Resource Efficiency in Small & Medium size ... - UNEP
Promoting Resource Efficiency in Small & Medium size ... - UNEP

You also want an ePaper? Increase the reach of your titles
YUMPU automatically turns print PDFs into web optimized ePapers that Google loves.
Raw material processed<br />
Maize 40<br />
Peas 40<br />
Potatoes 40<br />
Strawberries 60<br />
Apples 90<br />
All vegetables 130<br />
Peaches 180<br />
Broccoli 200<br />
Carrots 200<br />
Frozen peaches* 200<br />
Solid waste produced per tonne<br />
of product (kg)<br />
Table 50: Solid waste produced dur<strong>in</strong>g fruit and vegetable process<strong>in</strong>g<br />
* Product<br />
Specific value per tonne of beet<br />
processed<br />
Total energy (kWh) consumed<br />
Specific value per tonne of<br />
sugar produced<br />
Average Range Average Range<br />
307 232 – 367 1987 1554 - 2379<br />
Table 51: Energy consumption <strong>in</strong> Danish sugar factories<br />
* Product<br />
Energy<br />
Electrical energy<br />
Thermal energy<br />
Product<br />
Peas 0<br />
Sprouts 0<br />
Sp<strong>in</strong>ach 0<br />
Carrots (sliced) 1<br />
Carrots (diced) 2.5<br />
Salsifies 6<br />
Beans 9<br />
Peas 0<br />
Raw material M<strong>in</strong> Max<br />
(kWh/t raw material used)<br />
Maize 100 200<br />
Wheat 200 500<br />
Potato 40 80<br />
Maize 200 500<br />
Wheat 800 1300<br />
Potato 50 250<br />
Table 52: Energy consumption <strong>in</strong> the starch <strong>in</strong>dustry<br />
Electricity consumption (kWh/t)<br />
frozen vegetables<br />
Table 49: Electricity consumption of mechanical process<strong>in</strong>g of vegetables<br />
before freez<strong>in</strong>g<br />
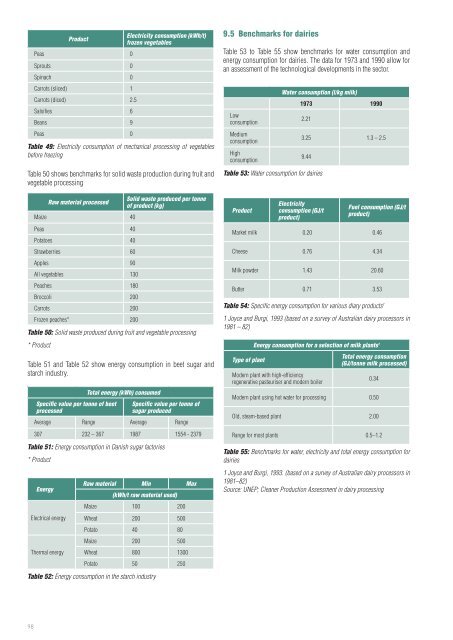
Table 50 shows benchmarks for solid waste production dur<strong>in</strong>g fruit and<br />
vegetable process<strong>in</strong>g<br />
Table 51 and Table 52 show energy consumption <strong>in</strong> beet sugar and<br />
starch <strong>in</strong>dustry.<br />
9.5 Benchmarks for dairies<br />
Table 53 to Table 55 show benchmarks for water consumption and<br />
energy consumption for dairies. The data for 1973 and 1990 allow for<br />
an assessment of the technological developments <strong>in</strong> the sector.<br />
Low<br />
consumption<br />
<strong>Medium</strong><br />
consumption<br />
High<br />
consumption<br />
Water consumption (l/kg milk)<br />
1973 1990<br />
2.21<br />
3.25 1.3 – 2.5<br />
9.44<br />
Table 53: Water consumption for dairies<br />
Product<br />
Electricity<br />
consumption (GJ/t<br />
product)<br />
Fuel consumption (GJ/t<br />
product)<br />
Market milk 0.20 0.46<br />
Cheese 0.76 4.34<br />
Milk powder 1.43 20.60<br />
Butter 0.71 3.53<br />
Table 54: Specific energy consumption for various diary products 1<br />
1 Joyce and Burgi, 1993 (based on a survey of Australian dairy processors <strong>in</strong><br />
1981 – 82)<br />
Type of plant<br />
Energy consumption for a selection of milk plants 1<br />
Modern plant with high-efficiency<br />
regenerative pasteuriser and modern boiler<br />
Total energy consumption<br />
(GJ/tonne milk processed)<br />
0.34<br />
Modern plant us<strong>in</strong>g hot water for process<strong>in</strong>g 0.50<br />
Old, steam-based plant 2.00<br />
Range for most plants 0.5–1.2<br />
Table 55: Benchmarks for water, electricity and total energy consumption for<br />
dairies<br />
1 Joyce and Burgi, 1993. (based on a survey of Australian dairy processors <strong>in</strong><br />
1981–82)<br />
Source: <strong>UNEP</strong>; Cleaner Production Assessment <strong>in</strong> dairy process<strong>in</strong>g<br />
98