Promoting Resource Efficiency in Small & Medium size ... - UNEP
Promoting Resource Efficiency in Small & Medium size ... - UNEP
Promoting Resource Efficiency in Small & Medium size ... - UNEP

Create successful ePaper yourself
Turn your PDF publications into a flip-book with our unique Google optimized e-Paper software.
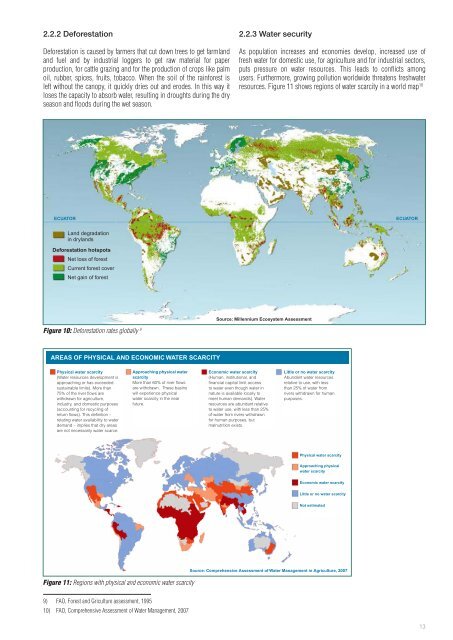
2.2.2 Deforestation<br />
Deforestation is caused by farmers that cut down trees to get farmland<br />
and fuel and by <strong>in</strong>dustrial loggers to get raw material for paper<br />
production, for cattle graz<strong>in</strong>g and for the production of crops like palm<br />
oil, rubber, spices, fruits, tobacco. When the soil of the ra<strong>in</strong>forest is<br />
left without the canopy, it quickly dries out and erodes. In this way it<br />
loses the capacity to absorb water, result<strong>in</strong>g <strong>in</strong> droughts dur<strong>in</strong>g the dry<br />
season and floods dur<strong>in</strong>g the wet season.<br />
2.2.3 Water security<br />
As population <strong>in</strong>creases and economies develop, <strong>in</strong>creased use of<br />
fresh water for domestic use, for agriculture and for <strong>in</strong>dustrial sectors,<br />
puts pressure on water resources. This leads to conflicts among<br />
users. Furthermore, grow<strong>in</strong>g pollution worldwide threatens freshwater<br />
resources. Figure 11 shows regions of water scarcity <strong>in</strong> a world map 10<br />
ECUATOR<br />
ECUATOR<br />
Land degradation<br />
<strong>in</strong> drylands<br />
Deforestation hotspots<br />
Net loss of forest<br />
Current forest cover<br />
Net ga<strong>in</strong> of forest<br />
Source: Millennium Ecosystem Assessment<br />
Figure 10: Deforestation rates globally 9<br />
AREAS OF PHYSICAL AND ECONOMIC WATER SCARCITY<br />
Physical water scarcity<br />
(Water resources development is<br />
approach<strong>in</strong>g or has exceeded<br />
susta<strong>in</strong>able limits). More than<br />
75% of the river flows are<br />
withdrawn for agriculture,<br />
<strong>in</strong>dustry, and domestic purposes<br />
(account<strong>in</strong>g for recycl<strong>in</strong>g of<br />
return flows). This def<strong>in</strong>ition –<br />
relat<strong>in</strong>g water availability to water<br />
demand – implies that dry areas<br />
are not necessarily water scarce.<br />
Approach<strong>in</strong>g physical water<br />
scarcity<br />
More than 60% of river flows<br />
are withdrawn. These bas<strong>in</strong>s<br />
will experience physical<br />
water scarcity <strong>in</strong> the near<br />
future.<br />
Economic water scarcity<br />
(Human, <strong>in</strong>stitutional, and<br />
f<strong>in</strong>ancial capital limit access<br />
to water even though water <strong>in</strong><br />
nature is available locally to<br />
meet human demands). Water<br />
resources are abundant relative<br />
to water use, with less than 25%<br />
of water from rivers withdrawn<br />
for human purposes, but<br />
malnutrition exists.<br />
Little or no water scarcity<br />
Abundant water resources<br />
relative to use, with less<br />
than 25% of water from<br />
rivers withdrawn for human<br />
purposes.<br />
Physical water scarcity<br />
Approach<strong>in</strong>g physical<br />
water scarcity<br />
Economic water scarcity<br />
Little or no water scarcity<br />
Not estimated<br />
Figure 11: Regions with physical and economic water scarcity<br />
Source: Comprehensive Assessment of Water Management <strong>in</strong> Agriculture, 2007<br />
9) FAO, Forest and Griculture assessment, 1995<br />
10) FAO, Comprehensive Assessment of Water Management, 2007<br />
13