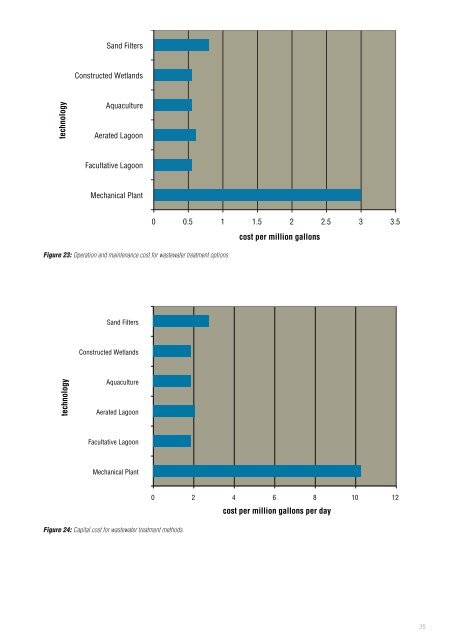
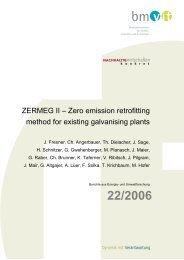
ivers are so badly polluted that not even <strong>in</strong>dustry can use the water and nearly two-thirds of the country’s largest cities have no wastewater treatment facilities. Ris<strong>in</strong>g water demand and the lack of adequate sanitation facilities are key reasons why almost 900 million people worldwide lack access to safe dr<strong>in</strong>k<strong>in</strong>g water and up to five million people die each year from water-related illness. Bus<strong>in</strong>ess impacts of water <strong>in</strong>security may <strong>in</strong>clude: • Decreased amount of water available for bus<strong>in</strong>ess activities • Operational disruptions and associated f<strong>in</strong>ancial loss • Impacts on future growth and license to operate • Conflicts with local communities and other large-scale water users • Regulatory restrictions for specific <strong>in</strong>dustrial activities and <strong>in</strong>vestments • Increased costs for water • Grow<strong>in</strong>g demand for water efficient products and technologies • Increased costs for pre-treatment to obta<strong>in</strong> desired water quality • Increased costs for wastewater treatment to meet more str<strong>in</strong>gent regulations Taken together, this means that bus<strong>in</strong>esses will face vastly <strong>in</strong>creased uncerta<strong>in</strong>ty about the availability and quality of their water supplies. Similar to <strong>Resource</strong> <strong>Efficiency</strong>, water efficiency is the accomplishment of a function, task, process or result with the m<strong>in</strong>imal amount of water feasible. In most sectors water is not a component of the product, but a cool<strong>in</strong>g, heat transfer or clean<strong>in</strong>g medium. Where water quality is concerned, zero effluent discharge is the ultimate goal, to avoid any release of contam<strong>in</strong>ants to the water environment. Zero effluent discharge entails water recycl<strong>in</strong>g, which also contributes to rais<strong>in</strong>g water efficiency. If zero effluent discharge is not economically and technically feasible, there are some valuable <strong>in</strong>termediate strategies <strong>in</strong>clud<strong>in</strong>g safer production, which can be pursued to reduce pollution and to ensure that waste substances are recovered and water reused. 4.2 WHY: Water sav<strong>in</strong>g benefits for SMEs Benefits of water efficiency for bus<strong>in</strong>ess: • Sav<strong>in</strong>g water will reduce the cost of water for the community at large by lower<strong>in</strong>g demand and thereby the associated costs of extraction, transport by pumps, treatment and wastewater disposal either <strong>in</strong> a company owned facility or a publically owned treatment plant. • Sav<strong>in</strong>g water can provide opportunities for develop<strong>in</strong>g efficiencies <strong>in</strong> other areas. For example, us<strong>in</strong>g less water may mean that pump<strong>in</strong>g water around the site is reduced lead<strong>in</strong>g to sav<strong>in</strong>gs <strong>in</strong> electricity costs and greenhouse emissions. • Sav<strong>in</strong>g water can reduce the risk of environmental contam<strong>in</strong>ation or pollution, as water efficiency <strong>in</strong>itiatives will lead to less wastewater. Additional general environmental benefits of water efficiency: • Fewer sewage system failures caused from excess water overload<strong>in</strong>g the system. • Healthy, rather than depleted and dried-up, natural pollution filters such as downstream wetlands. • Reduced water contam<strong>in</strong>ation caused by polluted runoff due to over irrigat<strong>in</strong>g agricultural and urban lands. • Reduced need to construct additional dams and reservoirs or otherwise regulate the natural flow of streams, thus preserv<strong>in</strong>g their free flow and reta<strong>in</strong><strong>in</strong>g the value of stream and river systems as wildlife habitats and recreational areas. • Reduced need to construct additional water and wastewater treatment facilities. • Elim<strong>in</strong>ation of excessive surface water withdrawals that degrade habitat both <strong>in</strong> streams and on land adjacent to streams and lakes. • Efficient water use can also reduce the amount of energy needed to treat wastewater, result<strong>in</strong>g <strong>in</strong> less energy demand and, therefore, fewer harmful byproducts from power plants. Figure 23 compares the operat<strong>in</strong>g and ma<strong>in</strong>tenance costs (labour, energy, chemicals, and materials such as replacement equipment and parts) of the various systems of 0.1 to 1 mgd (million gallons per day) treatment capacity. All costs were obta<strong>in</strong>ed from the USEPA Innovative and Alternative Technology Assessment Manual. They have been <strong>in</strong>dexed to the USEPA Operation, Ma<strong>in</strong>tenance, and Repair Index of Direct Costs for the first quarter of 1993 (4.3). All costs are presented <strong>in</strong> United States dollars per million gallons of wastewater treated. The cost for mechanical systems is significantly larger than for any of the other systems, particularly at smaller flows. The cost of harvest<strong>in</strong>g plants from aquaculture systems is not <strong>in</strong>cluded; this could be a significant amount for some systems. Most of the cost data come from systems implemented <strong>in</strong> the United States. Similar systems <strong>in</strong> Lat<strong>in</strong> America might be less expensive, <strong>in</strong> some cases, ow<strong>in</strong>g to lower labour costs and price differentials <strong>in</strong> construction materials. Nevertheless, the relative cost comparison among technologies is likely to be applicable to all countries. Figure 24 compares of the capital cost of the wastewater treatment processes. The cost data is also from the Innovative and Alternative Technology Assessment Manual, with the exception of wetland and aquaculture data, which were obta<strong>in</strong>ed from more recent sources. 27 All natural systems are assumed to have a facultative lagoon as the primary treatment unit. The cost of chlor<strong>in</strong>ation/dis<strong>in</strong>fection is <strong>in</strong>cluded for all systems except the slow rate and rapid <strong>in</strong>filtration systems. The cost of land is excluded <strong>in</strong> all cases, as is the cost of l<strong>in</strong>ers for the aquatic treatment systems. The mechanical treatment plant cost was derived as the cost of an oxidation ditch treatment system, and <strong>in</strong>cludes the cost of a clarifier, oxidation ditch, pumps, build<strong>in</strong>g, laboratory and sludge dry<strong>in</strong>g beds. These costs also <strong>in</strong>clude the cost of eng<strong>in</strong>eer<strong>in</strong>g and construction management, <strong>in</strong> addition to the costs for pip<strong>in</strong>g, electrical systems, <strong>in</strong>strumentation and site preparation. 27) All costs are <strong>in</strong> March 1993 US$ 34
Sand Filters Constructed Wetlands technology Aquaculture Aerated Lagoon Facultative Lagoon Mechanical Plant Figure 23: Operation and ma<strong>in</strong>tenance cost for wastewater treatment options 0 0.5 1 1.5 2 2.5 3 3.5 cost per million gallons Sand Filters Constructed Wetlands technology Aquaculture Aerated Lagoon Facultative Lagoon Mechanical Plant Figure 24: Capital cost for wastewater treatment methods 0 2 4 6 8 10 12 cost per million gallons per day 35
- Page 1 and 2: PRE-SME - Promoting Resource Effici
- Page 3 and 4: PRE-SME - Promoting Resource Effici
- Page 5 and 6: Table of Contents 1 THE PRE-SME PRO
- Page 7 and 8: Table of Contents 10 LAWS, REGULATI
- Page 10 and 11: 6 One
- Page 12 and 13: 8 Two
- Page 14 and 15: Total Population Land Area Figure 1
- Page 16 and 17: When done properly, Resource Effici
- Page 18 and 19: 50 40 30 20 10 0 Sr Ag Sb Au Zn As
- Page 20 and 21: It is evident that MIPS could be us
- Page 22 and 23: Hazardous substances and dangerous
- Page 24 and 25: 20 Three
- Page 26 and 27: Personnel from across the company c
- Page 28 and 29: Purchased 10 kg Einkaufsmenge 10.0k
- Page 30 and 31: 3.4 Check In the ‘Check’ phase,
- Page 32 and 33: 1,2 1 Water consumption in litres p
- Page 34 and 35: Case Study: Anodisieranstalt A. Heu
- Page 36 and 37: Detailed assessment: Water efficien
- Page 40 and 41: 4.3 HOW: Implement a water saving p
- Page 42 and 43: Step 3: Benchmark Performance Bench
- Page 44 and 45: Case Study: Ngege Ltd, Uganda (Prep
- Page 46 and 47: educe water use by 85%). Promote th
- Page 48 and 49: Detailed assessment: Energy efficie
- Page 50 and 51: 120 100 History of Consumption Proj
- Page 52 and 53: Step 1: Collect data The prime obje
- Page 54 and 55: • 22°C reduction in flue gas tem
- Page 56 and 57: • Paint ceilings and walls white.
- Page 58 and 59: Detailed assessment: Materials effi
- Page 60 and 61: Development of copper consumption T
- Page 62 and 63: Quick Win Map Steps Explained Basic
- Page 64 and 65: plastic grocery bag has been reduce
- Page 66: • Clean air conditioning and refr
- Page 69 and 70: Detailed assessment: Waste minimisa
- Page 71 and 72: 7.2.3 Waste in numbers 62 Total was
- Page 73 and 74: What Type of Waste Does Your Busine
- Page 75 and 76: • Return obsolete materials to su
- Page 77 and 78: Detailed assessment: Chemical effic
- Page 79 and 80: ignited by a high energy source. It
- Page 81 and 82: 8.2 WHY: Chemical efficiency benefi
- Page 83 and 84: Exploding bomb Flame Flame over cir
- Page 85 and 86: products and services are being del
- Page 87 and 88: Severity scale (Impact on company i
- Page 89 and 90:
Examples: • Overalls, aprons, gow
- Page 91 and 92:
neighbours, etc. If you are in doub
- Page 93 and 94:
Benchmarks This chapter provides se
- Page 95 and 96:
9.2 Benchmarks for the leather sect
- Page 97 and 98:
9.3 Benchmarks for paper production
- Page 99 and 100:
Table 32 gives options for the redu
- Page 101 and 102:
Table 41 to Table 45 show electrici
- Page 103 and 104:
9.6 Benchmarks for bread production
- Page 105 and 106:
Years manufactured Gravity tank sty
- Page 107 and 108:
Laws, regulations and standards 10.
- Page 109 and 110:
105
- Page 111 and 112:
Worksheet 1: Main products/services
- Page 113 and 114:
Worksheet 3: Energy data Company: R
- Page 115 and 116:
Worksheet 5: Flowchart (example) No
- Page 117 and 118:
Worksheet 7: Register of hazardous
- Page 119 and 120:
Worksheet 9: Risk assessment sheet
- Page 121 and 122:
Worksheet 11: Resource Efficiency p
- Page 123 and 124:
Worksheet 12: PRE-SME Report templa
- Page 125 and 126:
Worksheet 12: PRE-SME Report templa
- Page 127 and 128:
123
- Page 129 and 130:
12.1 References Association for the
- Page 131 and 132:
UNEP, Safer Production, http://www.
- Page 133 and 134:
129
- Page 135 and 136:
13.1 Unit Conversions APPROXIMATE C
- Page 137 and 138:
13.2 Steam Tables of Water Absolute
- Page 139 and 140:
About the UNEP Division of Technolo
- Page 141:
136