

Road safety data - Invercargill City 2010 - NZ Transport Agency
Road safety data - Invercargill City 2010 - NZ Transport Agency
Road safety data - Invercargill City 2010 - NZ Transport Agency

Create successful ePaper yourself
Turn your PDF publications into a flip-book with our unique Google optimized e-Paper software.
<strong>Invercargill</strong> <strong>City</strong> <strong>Road</strong> Safety Report 2005-2009<br />
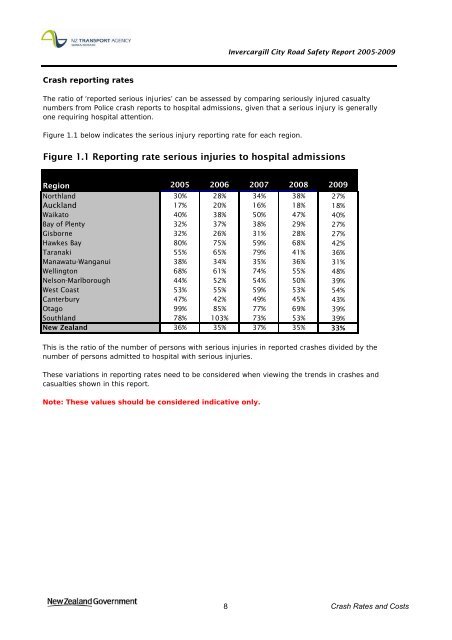
Crash reporting rates<br />
The ratio of ‘reported serious injuries’ can be assessed by comparing seriously injured casualty<br />
numbers from Police crash reports to hospital admissions, given that a serious injury is generally<br />
one requiring hospital attention.<br />
Figure 1.1 below indicates the serious injury reporting rate for each region.<br />
Figure 1.1 Reporting rate serious injuries to hospital admissions<br />
Region 2005 2006 2007 2008 2009<br />
Northland<br />
Auckland<br />
Waikato<br />
Bay of Plenty<br />
Gisborne<br />
Hawkes Bay<br />
Taranaki<br />
Manawatu-Wanganui<br />
Wellington<br />
Nelson-Marlborough<br />
West Coast<br />
Canterbury<br />
Otago<br />
Southland<br />
New Zealand<br />
30% 28% 34% 38% 27%<br />
17% 20% 16% 18% 18%<br />
40% 38% 50% 47% 40%<br />
32% 37% 38% 29% 27%<br />
32% 26% 31% 28% 27%<br />
80% 75% 59% 68% 42%<br />
55% 65% 79% 41% 36%<br />
38% 34% 35% 36% 31%<br />
68% 61% 74% 55% 48%<br />
44% 52% 54% 50% 39%<br />
53% 55% 59% 53% 54%<br />
47% 42% 49% 45% 43%<br />
99% 85% 77% 69% 39%<br />
78% 103% 73% 53% 39%<br />
36% 35% 37% 35% 33%<br />
This is the ratio of the number of persons with serious injuries in reported crashes divided by the<br />
number of persons admitted to hospital with serious injuries.<br />
These variations in reporting rates need to be considered when viewing the trends in crashes and<br />
casualties shown in this report.<br />
Note: These values should be considered indicative only.<br />
8 Crash Rates and Costs


