

Road safety data - Invercargill City 2010 - NZ Transport Agency
Road safety data - Invercargill City 2010 - NZ Transport Agency
Road safety data - Invercargill City 2010 - NZ Transport Agency

You also want an ePaper? Increase the reach of your titles
YUMPU automatically turns print PDFs into web optimized ePapers that Google loves.
<strong>Invercargill</strong> <strong>City</strong> <strong>Road</strong> Safety Report 2005-2009<br />
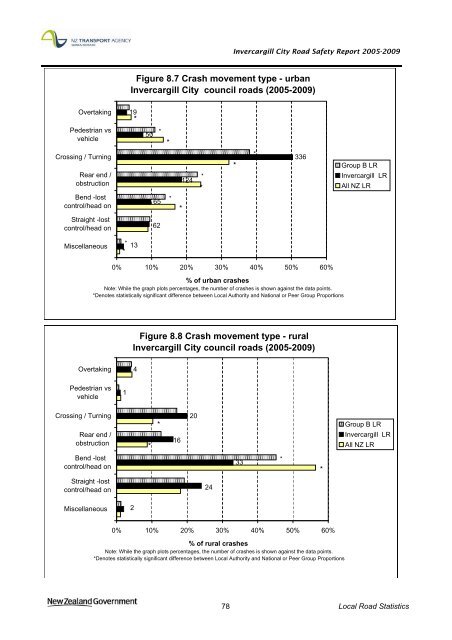
Figure 8.7 Crash movement type - urban<br />
<strong>Invercargill</strong> <strong>City</strong> council roads (2005-2009)<br />
Overtaking<br />
Pedestrian vs<br />
vehicle<br />
19<br />
*<br />
50<br />
*<br />
*<br />
Crossing / Turning<br />
Rear end /<br />
obstruction<br />
Bend -lost<br />
control/head on<br />
Straight -lost<br />
control/head on<br />
65<br />
62<br />
*<br />
*<br />
124<br />
*<br />
*<br />
*<br />
*<br />
336<br />
Group B LR<br />
<strong>Invercargill</strong> LR<br />
All <strong>NZ</strong> LR<br />
Miscellaneous<br />
*<br />
*<br />
13<br />
0% 10% 20% 30% 40% 50% 60%<br />
% of urban crashes<br />
Note: While the graph plots percentages, the number of crashes is shown against the <strong>data</strong> points.<br />
*Denotes statistically significant difference between Local Authority and National or Peer Group Proportions<br />
Figure 8.8 Crash movement type - rural<br />
<strong>Invercargill</strong> <strong>City</strong> council roads (2005-2009)<br />
Overtaking<br />
4<br />
Pedestrian vs<br />
vehicle<br />
1<br />
Crossing / Turning<br />
Rear end /<br />
obstruction<br />
*<br />
*<br />
16<br />
20<br />
Group B LR<br />
<strong>Invercargill</strong> LR<br />
All <strong>NZ</strong> LR<br />
Bend -lost<br />
control/head on<br />
33<br />
*<br />
*<br />
Straight -lost<br />
control/head on<br />
24<br />
Miscellaneous<br />
2<br />
0% 10% 20% 30% 40% 50% 60%<br />
% of rural crashes<br />
Note: While the graph plots percentages, the number of crashes is shown against the <strong>data</strong> points.<br />
*Denotes statistically significant difference between Local Authority and National or Peer Group Proportions<br />
78 Local <strong>Road</strong> Statistics


